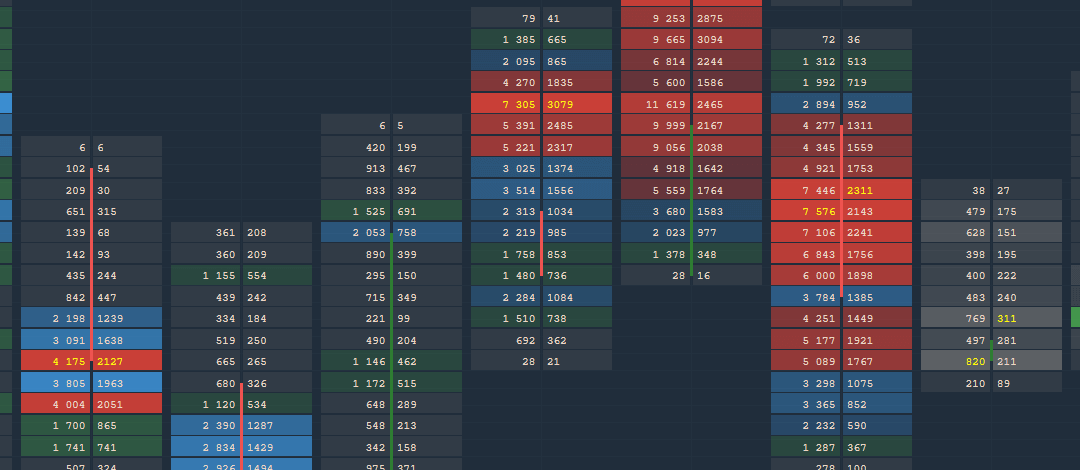
The new color scheme for the cluster chart will allow experienced traders to define more precisely the places and levels with a large volume, number of trades and delta. This is very similar to filtering, which at a given value of the cluster will apply the necessary color.
As an example, let’s see how it works on ES futures.
Go to the chart settings and select the desired data type on which to build the cluster. Then select Custom coloring in Cluster Visualization. Additional color settings will appear for the three cluster levels. At the first level, we will set 1000 contracts in one cluster, at the second 2000 and at the third 5000. For each level, set green, blue and red colors, respectively. If you zoom out the chart, then due to the color filtering we can see clusters with large volumes, i.e. zones of high interest.
Connection to Huobi Global crypto exchange
Added a new trading connection to the popular Huobi Global cryptocurrency exchange. This exchange offers traders 200+ cryptocurrencies and 500+ trading pairs. As for other crypto exchanges, here we also added two connection modes:
Info, allows you to connect without an API Key and make the necessary analysis of the selected cryptocurrency.
Trading mode. Requires unique API & Secret Keys to perform trading operations.
Custom Tick Size for Chart and DOM Surface panels
This setting allows you to “align” the chart to the desired tick size. For example, some data providers and exchanges do not provide the minimum value by which the price of a trading instrument changes. As a result, the price scale uses the wrong value of the price, creating gaps. This is especially noticeable on the Order Flow or DOM Surface charts. Using this setting, you can more accurately set the minimum price change and get the correct price display.
Added the function of minimizing a panel
Any open panel, group or bind can be minimized to the taskbar by clicking Minimize button. This function is quite simple and allows you to more conveniently work with open panels.
Changed the calculation of tick directions for Binance
We improved the mechanism for calculating tick directions, which is involved in volume tools. Earlier, when a new trade executed, if the price did not change, then the volume of this trade we referred to the None category and it did not refer to Buy or Sell. As a result, the total volume of trades marked None reached 50% of the total trading volume. Now, if a new trade has the same price as the previous trade, it is assigned a category, like the previous trade.
The first and main news of this release is the new DOM Surface panel, which has become an improved version of the existing Order Flow Surface panel. Connecting to Coinbase Pro, a new charting style and alerts for indicators are ready for use in the 3rdDimension platform
DOM Surface Panel — a brand new view on order flow analysis
The liquidity analysis in the Order Book gives a key to understanding the market and allows you to see patterns and levels from which the price can bounce back with a high probability. For this purpose, the Order Flow Surface panel is already available in our platform, which shows all changes and evolution in limit orders in the form of a map. But we went further 🙂
Today we are pleased to present DOM Surface — a new and improved tool for professional analysis of order flow. So, let’s see what’s interesting in it:
Added three coloring modes to visualize the liquidity map—Monochrome, Bichrome, Heatmap.
The execution of market orders is shown in the form of Circles. Red circles indicate the execution of sell orders, and greencirclesindicate the execution of buy. The size of thecircle corresponds to the order volume. In the settings of the panel, you can set the maximum size of thecircle, its opacity, as well as the maximum trade size.
In addition to theLast Tradeline, you can includeBid/Ask lineson the chart. For each line, you can set any color for a better perception.
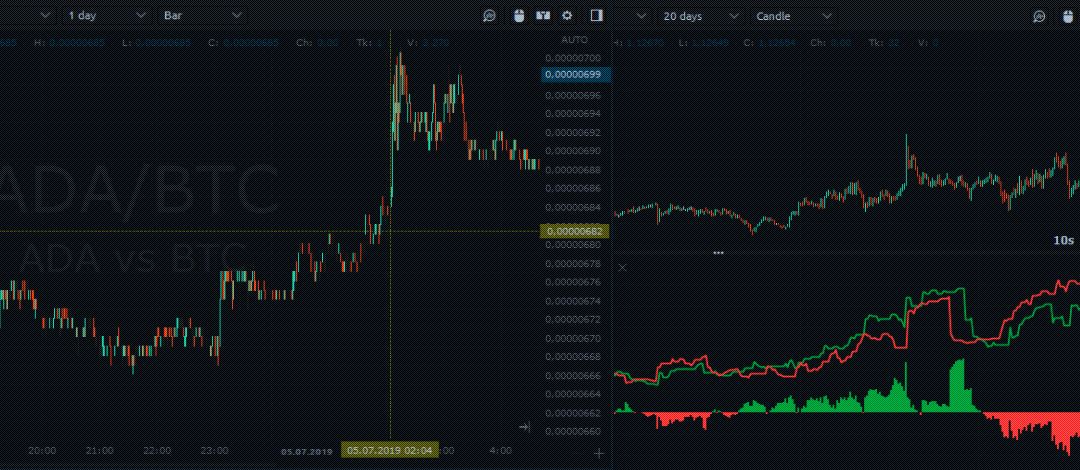
On the right side of the panel, there are three histograms—Size, Cumulative Size, Order Book Imbalance. Sizeshows the volume of limit orders at each price. Cumulative Sizeshows the sum of Limit order volumes for each subsequent level. This histogram allows estimating the dominating side of the market. Imbalanceshows how many percents of buyers are more than sellers (and vice versa) for each price level.
When you move the cursor over the map area, information on the level and volume at each price will be displayed in the upper left corner. By activating theinfo mode, you can hover over anycircle and see the actual size of the executed order.
The main bar of the panel has quick settings where you can set the required number of DOM levels, as well as their contrast. This allows you to focus on levels with high liquidity.
Added 9Hot Keysto perform basic trading operations: placing market orders, placing limit orders by the best bid/offer price, canceling orders and closing positions. This is by far great addition which allows you to quickly respond to changing market conditions.
We have added an auto-centering of the chart, which aligns the price position in case the bid/ask lines go beyond the chart visibility.
Alerts for Indicators
At the user’s request, we added alerts for indicators. After setting an alert on the necessary indicator, it will be active until the specified condition is met. Alert placement is performed in the same way as on the main chart, i.e. through the“Bell”icon
And that’s where I have to say goodbye, but not for long. We have more other news coming your way very soon, so keep your eyes open!
By the way, speaking of the updates. To get the new version, click on the “Logo” icon and open the sidebar, then press the “NEW VERSION” button at the bottom and get on About screen. Press the “DOWNLOAD” button, and 3rdDimension will download the latest version and prepare it for the update.
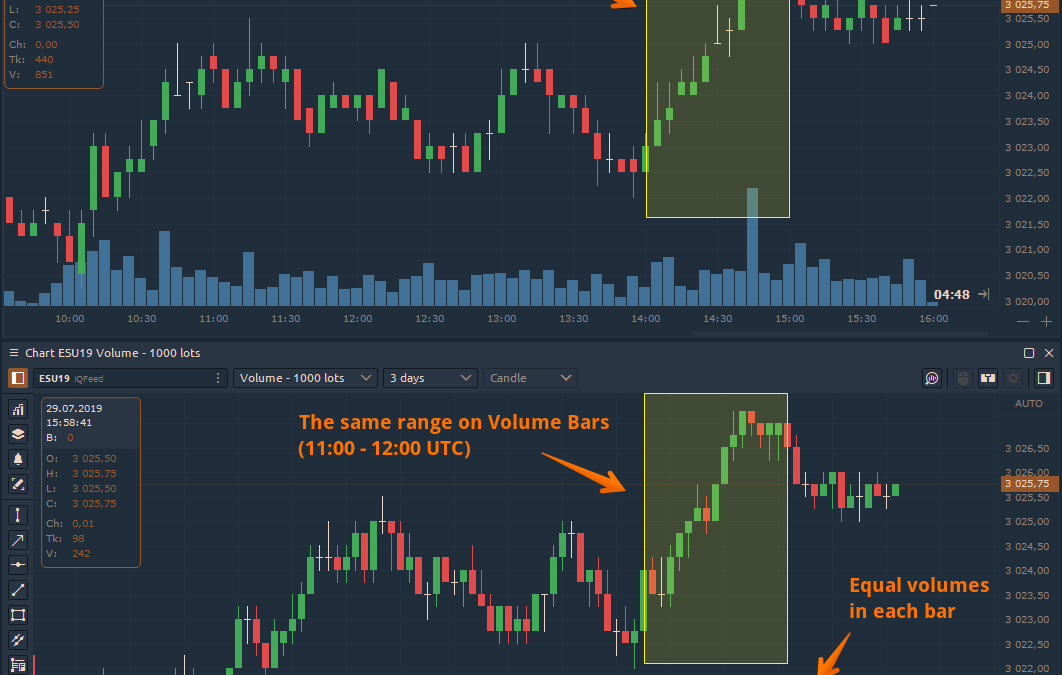
Volume Bars are built based on volume data — tick or exchange volume when available. Time is not involved in this aggregation. Each bar in a Volume Bar chart contains a specified volume level. This volume level is reached by accumulating the volume of each of the underlying bars. When the volume level is reached, the next Volume Bar begins to accumulate volume from the underlying bars.
Volume Bars chart is based on volume data like ticks and exchange volume
3rdDimension 1.39 supports Real-Time Data (RTD) function for sending data and other market information to Microsoft Excel®. This feature opens up many opportunities for creating custom displays and other ways to better manage your workflow. For instance, you can transmit real-time market data, account info and analyze it on your own. You can use our example Excel file to evaluate RTD possibilities. Also, read our help guide on how to activate RTD and how to work with it in Excel.
Binance got an Info Mode. Access to real-time market data without a trading account
The Info Mode lets you connect to the Binance exchange without using the API key, and receive real-time data for all available cryptocurrencies. This mode will be useful for a complete analysis of the market situation, including with the help of Volume Analysis Tools, Order Flow, and various chart types.
Power Trades Scanner got predefined settings templates
In order for Power Trades to work properly, it is important to set the parameters that will best suit the specific symbol. Therefore, to make it easy to use the scanner, we have prepared predefined setup templates for 36 instruments traded on the Binance exchange. These settings are the starting point for the use of Power Trades, and every user can set more precise parameters on their own.
So, the screenshot below shows the list of symbols for which we have prepared templates.
Level 2 Indicator
The indicator shows DOM levels with volumes at each price level directly on the chart. This allows you to monitor changes in the DOM without having to open the panel itself. In the settings of the indicator, you can specify the required number of levels, colors, as well as the width of the occupied area on the chart.
Indicator of Separated ATRs
This is a volatility indicator that shows the difference between the two ATR indicators:
the first ATR takes into account only the growing bars
the second ATR only counts falling bars.
Symbol Description on the chart
On the background of the chart, we have added the name of the trading instrument, which you can optionally enable/disable in the general settings of the panel.
One of the great new features, that was developed based on a traders feedback — an abbreviation of crypto prices. This feature allows you to apply a special “shortening” for prices of Crypto-symbols only, resulting in “useless zeros” removal. The algorithm is simple — we just hide all “0” symbols from the left side of price and replace with “..”, for example, 0.0000145 -> ..145. This feature applies globally for all crypto-symbols in application thus changes price values in all panels.
Indicators data in watchlist filters/alerts
Another great advice from our community lead us to develop a possibility to use calculated values of indicators in Watchlist filtering & alerts. Old 3rdDimension traders already know about the possibility to add indicators in Watchlist and see their values in separate columns. Now you can use that values in Table actions functionality (Settings -> Setup actions) to filter rows of call an alert. This simple and yet powerful possibility is available starting from Free version of 3rdDimension .
Omni trend indicator
The Omni Trend indicator (based on the NRTR indicator by Konstantin Kopyrkin) is a trend indicator that uses Average True Range & Moving Average to generate trading signals: buy — when price reaches the previous high & sell — when the price below the previous low.
NRMA indicator
Another interesting indicator that might tell you when go long or short — NRMA indicator. It consists of dots, placed around the price, that suggest bearish (dots are above) or bullish (dots are below) price actions. You can find a lot of information on best practices for this indicator on the internet, but in short: buy when dots are below the price and sell when they are above.
At the request of our customers, we added a list of new technical indicators:
Donchian Channel
High/Low indicator
Super Trend indicator
Ichimoku indicator
Pivot Points
Stochastic momentum index
Guppy Multiple moving averages
Triple Exponential Averages
Improvements in Watchlist panel
Creating a new panel from Watchlist
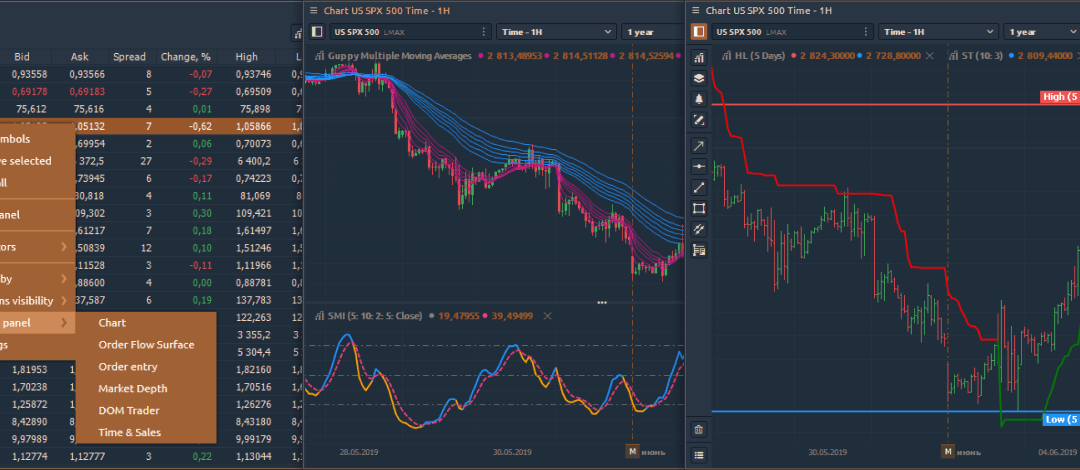
We’ve added the option to quickly open a new panel for the selected symbol from Watchlist. When you right-click on a symbol, you will see the list with 6 available panels: Chart, Order Flow, Order Entry (or Crypto Order Entry), Market Depth, DOM Trader, Time & Sales.
Manual sorting of the list of instruments in Watchlist
After adding symbols to Watchlist, users can sort or filter the list by each column. In this version, we have added drag and drop of individual rows to any location on the list for full customization.
Quick lock of the Watchlist
This option will protect Watchlist from accidental sorting, deletion of columns or cleaning of the whole list after its setting up. Activation and deactivation of this mode are performed by clicking on the “Lock” icon on the Watchlist panel, as well as from the panel’s context menu.
Search news in the RSS panel
Navigation in the RSS panel has become easier by the search mechanism for news on the required company or a specific event. Enter the company name in the search field and all related news will be filtered.
Improved Symbol Lookup Search Engine
For searching a trading instrument in the Symbol Lookup, you can now enter not only the ticker but also the name and description of the asset. This simplifies the search in cases if you do not know the exact ticker of the trading instrument. The system searches for both one word and a group of words in any order separated by a space.
Thank you for choosing our trading software! In this short guide, we will tell you how to install 3rd Dimension and start trading immediately. Let us tell you about the main differences between our “installation process” and default Windows® install process, that most users are accustomed to.
Firstly, 3rd Dimension does not copy it’s files to the system folders (AppData or Program Files) of the OS, nor does write changes to the system registry. What does it mean? The program doesn’t violate the integrity of the OS, and in case of uninstalling, it will not leave any prints of its presence on your computer. 3rd Dimension “installer” only extracts files to the user-specified folder.
Secondly, the application can be easily stored on removable Drive for use on any other computer as the portable application. It can be convenient when you need to move 3rd Dimension with all of its settings to another PC; just copy 3rd Dimension folder and paste where you need.
To install 3rd Dimension follow these 3 simple steps:
Select the folder to extract application files 3rd Dimension setup screen
Once an extraction process being finished the platform will start automatically with Emulator connection and default workspace.
From this moment you can start trading and analysis as well as workspace modification.
Uninstall
If you need to uninstall the application, just delete the folder with all application files. You may also keep your personal settings (connection information & workspaces) by copying the Settings folder (can be found right in 3rd Dimension folder) before application delete. These Settings folder can be pasted to any other 3rd Dimension folder later. BTW, we are planning to make it possible to store your Settings in 3rd Dimension cloud later.
Updating
When new updates arrive, a user receives an audio signal as well as visual notification in the form of a highlighted platform logo.
Click on this logo, and at the bottom of the start menu, you will see the New Version button, by clicking on which you run the update screen. This screen shows the installed version of the platform.
More details about how to use the 3rd Dimension you can found in our Quick Start Guide.
In case of any questions, please contact us via the preferred contact channel.
Just after the official release of 3rd Dimension trading application, we announce the first trading connection with Poloniex crypto-exchange. Now any trader can try the brand-new trading application using the live account on one of the most popular crypto-exchanges.
When we were thinking about the first connection for our trading application, we decided to start from emerging market, that is fastly growing and attracting a lot of new traders each day. That is why we came to market of digital assets (or Crypto-currency) and started from one of the most popular Exchanges on it – Poloniex.
All needed is on-board
The first release of 3rd Dimension trading application consists of a number of basic functionalities, suitable for Crypto-trading, like “Chart” with a huge set of drawings and indicators, “Order entry” (including limit orders), “Depth of market” and “Watchlist”. Trader can also see and manage its opened orders and positions using functional “Positions” and “Orders” panels. Additionally, trader will like an informational panels “Symbol Info” & “Account Info” that gives the all available information about the account and trading instruments.
Trade on Poloniex using familiar tools via 3rd Dimension trading application
What else can 3rd Dimension propose to Poloniex trader?
The answer is – convenient trading environment. We paid a lot of attention to making the interface of 3rd Dimension as much flexible as possible, giving the trader various leverages for workspace modification. It is possible to set up, group, bind panels and organize them in different trading environments, so-called – Workspaces. Worth to mention, that each separate panel can be customized individually via the personal settings screens. Trader can also set up the default “Setting Layouts” per each panel scope.
Wow. Looking on all of these advantages it is hard to ignore the possibility to try the 3rd Dimension trading application with Poloniex account. In addition, we should mention, that being in an early stage, 3rd Dimension is absolutely free-to-use application so don’t hesitate and go to Download 3rd Dimension right now.
And don’t forget to share your thoughts and impressions with our team via your preferred way. We, the 3rd Dimension Team, are always ready to hear any trader and do the best we can, to make your trading as much profitable as possible.
The rapid development of crypto technologies pushes on the adaptation of not only market participants but also devs of trading applications. 3rd Dimension trading platform continues to expand its list of crypto connections and offers to an increasing number of traders the usage of cool charting and analytical functionality.
We are pleased to introduce the new crypto exchange — Binance — in the arsenal of our trading application’s connections. It means that now you can trade in crypto-currencies, using a wider trading functionality list:
Flexible customization of trading workspaces with an ability to create Binds of panels and save it as Templates.
Time & Sales panel, allowing to filter the trades over a specified size.
Placing orders via the powerful DOM trader panel.
Crypto-balances panel for checking your wallets.
Crypto Order Entry panel, for convenient opening of crypto orders.
Various order types, chart types, drawings, and indicators.
History Player panel, that allows conducting manual backtesting of your trading strategy without any risk.
24/7 market access just like the exchanges.
Binance workspace in 3rd Dimension trading terminal
How to start trading on Binance exchange using 3rd Dimension platform?
Generate an API key on Binance to create a trade connection with 3rd Dimension. Use this API key to log into the platform.
You may watch a short video, demonstrating the basic principles of getting started with Binance in 3rd Dimension application:
Important: Order execution happens on the exchange side. We are merely displaying the information that we receive from the exchange.
Btw, this is not the first connection to crypto-exchange. Earlier, we have connected to the Poloniex crypto exchange, which is also available for trading through 3rd Dimension.


