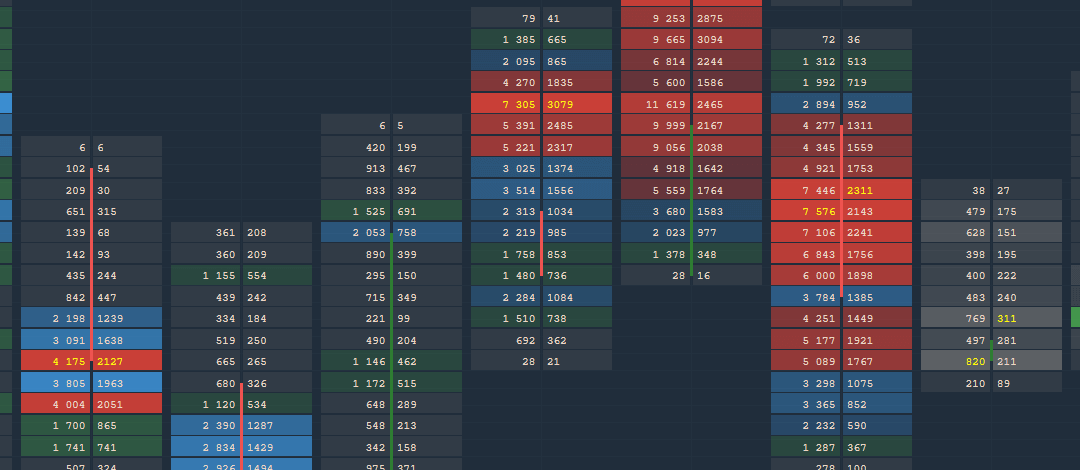
The new color scheme for the cluster chart will allow experienced traders to define more precisely the places and levels with a large volume, number of trades and delta. This is very similar to filtering, which at a given value of the cluster will apply the necessary color.
As an example, let’s see how it works on ES futures.
Go to the chart settings and select the desired data type on which to build the cluster. Then select Custom coloring in Cluster Visualization. Additional color settings will appear for the three cluster levels. At the first level, we will set 1000 contracts in one cluster, at the second 2000 and at the third 5000. For each level, set green, blue and red colors, respectively. If you zoom out the chart, then due to the color filtering we can see clusters with large volumes, i.e. zones of high interest.
Connection to Huobi Global crypto exchange
Added a new trading connection to the popular Huobi Global cryptocurrency exchange. This exchange offers traders 200+ cryptocurrencies and 500+ trading pairs. As for other crypto exchanges, here we also added two connection modes:
Info, allows you to connect without an API Key and make the necessary analysis of the selected cryptocurrency.
Trading mode. Requires unique API & Secret Keys to perform trading operations.
Custom Tick Size for Chart and DOM Surface panels
This setting allows you to “align” the chart to the desired tick size. For example, some data providers and exchanges do not provide the minimum value by which the price of a trading instrument changes. As a result, the price scale uses the wrong value of the price, creating gaps. This is especially noticeable on the Order Flow or DOM Surface charts. Using this setting, you can more accurately set the minimum price change and get the correct price display.
Added the function of minimizing a panel
Any open panel, group or bind can be minimized to the taskbar by clicking Minimize button. This function is quite simple and allows you to more conveniently work with open panels.
Changed the calculation of tick directions for Binance
We improved the mechanism for calculating tick directions, which is involved in volume tools. Earlier, when a new trade executed, if the price did not change, then the volume of this trade we referred to the None category and it did not refer to Buy or Sell. As a result, the total volume of trades marked None reached 50% of the total trading volume. Now, if a new trade has the same price as the previous trade, it is assigned a category, like the previous trade.
The first and main news of this release is the new DOM Surface panel, which has become an improved version of the existing Order Flow Surface panel. Connecting to Coinbase Pro, a new charting style and alerts for indicators are ready for use in the 3rdDimension platform
DOM Surface Panel — a brand new view on order flow analysis
The liquidity analysis in the Order Book gives a key to understanding the market and allows you to see patterns and levels from which the price can bounce back with a high probability. For this purpose, the Order Flow Surface panel is already available in our platform, which shows all changes and evolution in limit orders in the form of a map. But we went further 🙂
Today we are pleased to present DOM Surface — a new and improved tool for professional analysis of order flow. So, let’s see what’s interesting in it:
Added three coloring modes to visualize the liquidity map—Monochrome, Bichrome, Heatmap.
The execution of market orders is shown in the form of Circles. Red circles indicate the execution of sell orders, and greencirclesindicate the execution of buy. The size of thecircle corresponds to the order volume. In the settings of the panel, you can set the maximum size of thecircle, its opacity, as well as the maximum trade size.
In addition to theLast Tradeline, you can includeBid/Ask lineson the chart. For each line, you can set any color for a better perception.
On the right side of the panel, there are three histograms—Size, Cumulative Size, Order Book Imbalance. Sizeshows the volume of limit orders at each price. Cumulative Sizeshows the sum of Limit order volumes for each subsequent level. This histogram allows estimating the dominating side of the market. Imbalanceshows how many percents of buyers are more than sellers (and vice versa) for each price level.
When you move the cursor over the map area, information on the level and volume at each price will be displayed in the upper left corner. By activating theinfo mode, you can hover over anycircle and see the actual size of the executed order.
The main bar of the panel has quick settings where you can set the required number of DOM levels, as well as their contrast. This allows you to focus on levels with high liquidity.
Added 9Hot Keysto perform basic trading operations: placing market orders, placing limit orders by the best bid/offer price, canceling orders and closing positions. This is by far great addition which allows you to quickly respond to changing market conditions.
We have added an auto-centering of the chart, which aligns the price position in case the bid/ask lines go beyond the chart visibility.
Alerts for Indicators
At the user’s request, we added alerts for indicators. After setting an alert on the necessary indicator, it will be active until the specified condition is met. Alert placement is performed in the same way as on the main chart, i.e. through the“Bell”icon
And that’s where I have to say goodbye, but not for long. We have more other news coming your way very soon, so keep your eyes open!
By the way, speaking of the updates. To get the new version, click on the “Logo” icon and open the sidebar, then press the “NEW VERSION” button at the bottom and get on About screen. Press the “DOWNLOAD” button, and 3rdDimension will download the latest version and prepare it for the update.
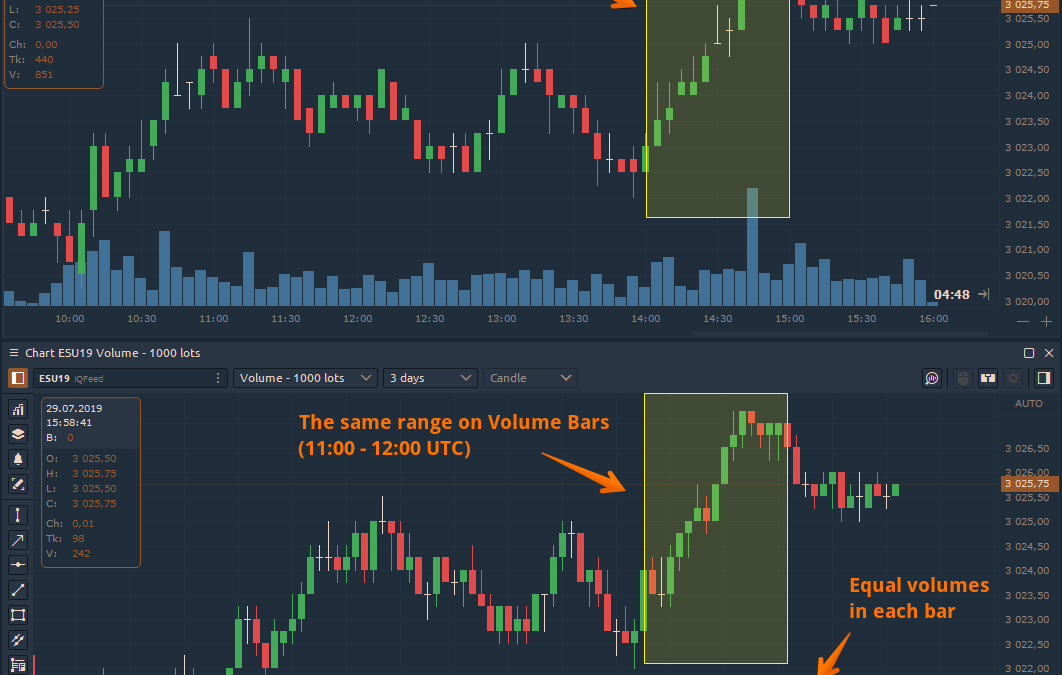
Volume Bars are built based on volume data — tick or exchange volume when available. Time is not involved in this aggregation. Each bar in a Volume Bar chart contains a specified volume level. This volume level is reached by accumulating the volume of each of the underlying bars. When the volume level is reached, the next Volume Bar begins to accumulate volume from the underlying bars.
Volume Bars chart is based on volume data like ticks and exchange volume
3rdDimension 1.39 supports Real-Time Data (RTD) function for sending data and other market information to Microsoft Excel®. This feature opens up many opportunities for creating custom displays and other ways to better manage your workflow. For instance, you can transmit real-time market data, account info and analyze it on your own. You can use our example Excel file to evaluate RTD possibilities. Also, read our help guide on how to activate RTD and how to work with it in Excel.
Binance got an Info Mode. Access to real-time market data without a trading account
The Info Mode lets you connect to the Binance exchange without using the API key, and receive real-time data for all available cryptocurrencies. This mode will be useful for a complete analysis of the market situation, including with the help of Volume Analysis Tools, Order Flow, and various chart types.
Power Trades Scanner got predefined settings templates
In order for Power Trades to work properly, it is important to set the parameters that will best suit the specific symbol. Therefore, to make it easy to use the scanner, we have prepared predefined setup templates for 36 instruments traded on the Binance exchange. These settings are the starting point for the use of Power Trades, and every user can set more precise parameters on their own.
So, the screenshot below shows the list of symbols for which we have prepared templates.
Level 2 Indicator
The indicator shows DOM levels with volumes at each price level directly on the chart. This allows you to monitor changes in the DOM without having to open the panel itself. In the settings of the indicator, you can specify the required number of levels, colors, as well as the width of the occupied area on the chart.
Indicator of Separated ATRs
This is a volatility indicator that shows the difference between the two ATR indicators:
the first ATR takes into account only the growing bars
the second ATR only counts falling bars.
Symbol Description on the chart
On the background of the chart, we have added the name of the trading instrument, which you can optionally enable/disable in the general settings of the panel.