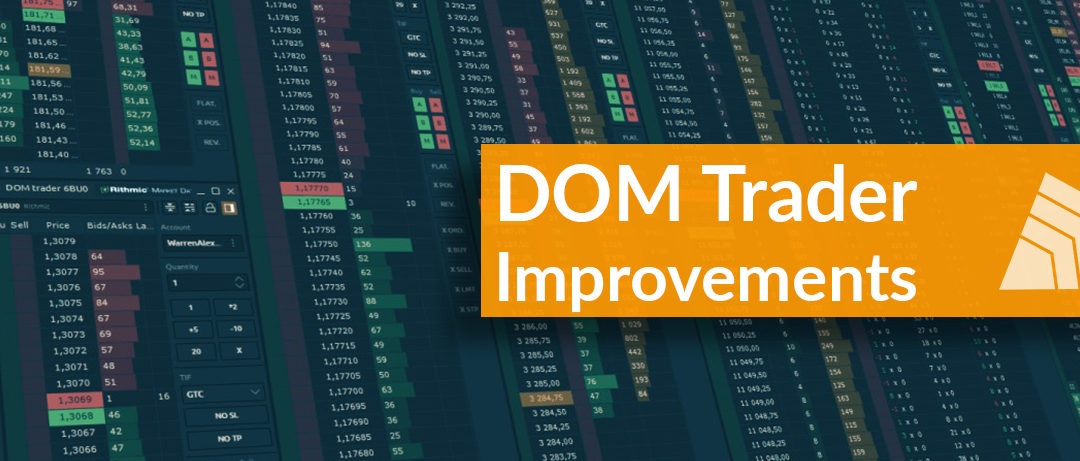
We’re always working hard to make ThirdDimension better and especially its main trading panels like DOM Trader. For the last month, hotkeys, visual changes, and improved performance have been added to this panel!
● Added Total Rows for Bids, Asks, Buy and Sell columns. This row shows the total number of placed orders at different prices that are outside the visibility area. In addition, it shows the sum of limit orders at Bid and Ask side, allowing to estimate the imbalance between buyers and sellers.
● Added the ability to change Custom tick size “on the fly” by holding Ctrl key and scrolling the mouse wheel.
● Added the ability to set the number of levels for Bid/Ask columns.
● Added the Ctrl+Q hotkey that will call a small window where you can quickly change the Order Quantity.
● Ctrl+1, Ctrl+2, etc. hotkeys will apply predefined Order Quantity from the list. This list can be changed in the panel settings by specifying the necessary order sizes or adding more buttons.
● Added a new confirmation that will ask about closing the panel. This option will save from accidental panel closing.
● Visual marker of the size for a new order. In case of accidental changes in the order size, you will notice with what volume the new order will be set.
● Increased speed of placing, modifying, and canceling orders with Rithmic connection.
DOM Trader improvements
Added a tooltip that shows the size of the order that trader is going to place. This will allow hiding the order entry sidebar, focus only on the trading process and always understand the order size that will be placed in the market.
Also, for Binance and Binance futures we haveimproved the Cancel Orders function, which will cancel all orders simultaneously (!). For those who actively trade cryptocurrencies and place a large number of orders, this option will speed up the cancellation of working orders.
Hope you enjoy the new Imbalance feature, and let us know what you think! Leave your questions and feedback and our team will be happy to help!
Connection to CTS technology
Cunningham Trading Systems (CTS) is a technology that provides access to many of the world’s largest exchanges for trading futures, options. In fact, it is the same trading connection as Rithmic, with a wide coverage of exchanges and brokers.
Improved DOM Trader panel with Slim mode
All major changes can be grouped into two categories: visual changes, new columns & features.
Updated UI for Order Entry sidebar
Thanks to close cooperation with professional traders, we have made many visual changes for the Order Entry sidebar. Firstly, it became 30% smaller and we also added Slim mode which reduces the size of the sidebar by 60% (!). For traders who have DOM as their main trading panel, this compact view will be appreciated. In addition, for even more space savings, you can remove signatures of some fields using the No Labels option.
Drag & Drop columns
Another important change we’ve implemented in the panel is the resizing and dragging of all the columns to any location. As a result, each trader will be able to customize the appearance of the panel at his own discretion.
Quick quantity buttons improvements
Surely many of you are already familiar with Quick quantity buttons, on which you can set any order volume. In the new version, we have added support for mathematical signs before the values to quickly increase, decrease or reset the current value.
Liquidity changes column (known as Pulling and Stacking)
Pulling and Stacking describe the summary of the Liquidity Order Book (LOB) for Bid and Ask Side separately. Stacking shows an increasing Volume in the Order Book for the Sell-Side (Ask) or Buy-Side (Bid) and reflects therefore a supportive intention for the price to move in the corresponding direction. Whereas the Pulling shows a decrease in the Volume in the Order Book and therefore a lack of interest.
If you are considering a short position, buyers pulling bids and sellers stacking offers can provide a trigger for a trade.
If you are considering a long position, buyers stacking the bids and sellers pulling the offers can provide a trigger for a trade.
Number of changes and Cumulative changes columns
Number of changes shows how many times the values have changed at a particular price level (Bids x Asks). Cumulative changes shows the total volume that changed at a specific price level since the panel launched.
Why Number of Changes and Cumulative changes are important?
The liquidity on the Depth of market is constantly changing due to very different types of reasons. The fast changes occurring simultaneously on the bid and ask side are very difficult to track with the naked eye. It becomes even worse when you have over 10 levels.
This is the part where the number of changes and cumulative changes comes on handy. For a buy trade, you would expect to see an increasing number of changes combined to higher cumulative changes showing increasingly adding liquidity at a higher pace. Even better, would it be combined to a higher cumulative change on the ask side to the downside, showing participants eager pulling out the liquidity.
In addition, all three columns have several reset modes:
manual reset of every single column via the context menu
automatic reset after a certain time or after a specified number of ticks.
Flexible position management in Option Analytics
Position and strategy management in the Option Analytics panel has become more flexible, thanks to a quick selection of strikes, a reversal button of a single strike or a strategy, and increased volume. In addition, when adding several different strategies, you can quickly include or exclude the entire strategy or a single strike from the profile analysis mode.
Trailing Stop order with Rithmic
After launchingbracketandOCO ordersfor Rithmic several months ago, we made further improvements to our advanced order types.Trailing Stopis now available on ThirdDimension platform with Rithmic to better help you automate trades and mitigate risk. This order type tracks the current price against the existing position. Once the price is on a positive side for you, the stop order moves closer, reducing the risk.
TPA is the first trade personal assistant invented by eng. Sadik Bitar. It’s a bot that can help you manage your trades in advance, automate your entry and exit, to have the ability to apply complex trading scenarios.
Every trader needs to take 3 decisions in each trade:
1- when to enter (the price of entering the trade).
2- when to exit (an exit price).
3- The quantity (capital percentage).
Those three decisions have to be taken regardless of the applied strategy, here TPA comes in handy. TPA allows you to configure entry and exit conditions in advance.
You can choose to enter the trade in so many different situations, whether it’s resistance breakout, buy support, to enter when the price hit a certain value, to enter when a bar or candle close, or to enter when you break resistance and retest it, and to choose a type of your order whether it’s a limit or market or local limit.
The same concept or conditions are applied in the exit behavior whether it’s “ take a profit TP or stop loss SL or exit when entry condition fail (false breakout)”
What is even more unique about TPA is that you can apply all these scenarios by drawing on the chart.
It literally can take 3 seconds to apply a complex trading strategy and run it. From that point forward, TPA will handle the execution of your conditions and strategy automatically without even sleeping. In addition, the TPA manager lists all TPA strategies across charts so it becomes easy and convenient to see and manage all your trades and even change any value or condition live.
Another unique benefit of TPA is the ability to keep your capital free and not reserved in a limit order while you are waiting for the price to activate the order. And that’s by using the local-limit order type where it saves the condition inside the strategy and not sending it to the exchange, therefore you have free capital (margin) to run multiple TPA trades on multiple charts (opportunities) at the same time the TPA will activate the trades that respect your conditions first so you save time by not waiting your orders to be filled and you take advantage of liquid and fast base pairs.
How To Run TPA?
To run TPA you have 2 options:
First: by opening a chart then choosing TPA from drawing tools at the left side and the just click anywhere in the chart then TPA will appear with its default values .
Second: open the TPA manager from the main menu and click + and choose a pair that you want to trade on. Next, click settings and fill all the conditions according to your scenario.
Right now you find settings that have 6 sections:
general, enter, exit, TP, Sl, logs.
General:
strategy:
1.In strategy, you choose the general behaviour of the trade:
You can pick ResistanceBreakout when you want to trade breakout of a certain resistance or price (the current price should be below the enter price)
Pick BuySupport when you want to enter the trade when the price moves down to a certain level. (current price should be above the enter price)
Pick TPnSL if you want to use TPA as a Take Profit and Stop Loss only. (you have to fill a quantity that you want to sell manually).
2.You can enable or disable the extra exit behavior by clicking on this option.
3.Repetition behaviour:
One time: strategy will stop after it executes enter and exit behaviour.
Continuous: strategy will run enter behaviour each time if exit behaviour occurs. Note continuous behaviour applies only after exit behaviour and not after TP and SL behaviour.
Time frame:
choose the time frame of the chart that you want to trade on. (same time frame will be applied to the candlesticks in the condition behaviour)
Order Parameters:
1.Account: select the exchange licence (connected API).
2.Symbol: select trading pair.
3.Quote Percentage: percentage of your quote quantity that you want to enter the trade with.(BTC/USDT = Base/Quote).
4.Calculate Quantity at run time: when checked, TPA will calculate the Base quantity at the execution price of the trade (it gives you the advantage of dynamic allocation of the capital, it calculates the Quote percentage based on the remaining Quote quantity).
5.Save Fees:when checked, TPA will set the enter price below the Enter price specified the settings with a percentage equivalent to exchange Fees.
6.Base – Quantity (applied):The quantity that applied in the trade (calculated automatically from Quote Percentage at the current price of the pair).
7.Quote – Quantity: The equivalent of base quantity in the Quote currency.(calculated automatically from Base Quantity at the current price of the pair).
Enter:
1.Enter event: choose the type of the enter behavior event.
On price hit: execute Buy trade when the price hits Buy Price.
On Bar close: execute Buy trade when a Bar/Candlestick closes above Trigger price.
On Bar retest: execute Buy trade when Bar/Candlestick closes above Trigger price and retrace/go back to the Buy price.
2.Enter order type:
Limit: execute limit buy order, when the condition is met.
Market: execute market buy order, when the condition is met.
Local limit: execute local limit buy order, when the condition is met.
TPA will put a buy limit order when price goes below LocalLimit trigger price and will delete this buy limit order when the price goes above this LocalLimit trigger price.
3.Trigger Price (%): a percentage that will be added to the Buy price.
4.Trigger Price: it’s a specific price that’s calculated from the Trigger Price (%).
5.LocalLimit Trigger Price (%): a percentage that will be added to the LocalLimit Trigger Price.
6.LocalLimit Trigger Price: it’s a specific price that’s calculated from the LocalLimit Trigger Price (%).
7.Buy Price: is the exact price that the trade will execute a buy order on.(note: when Enter Event is set to OnBarClose then the trade will execute the buy order at the close price of the candle that closed above Buy Price).
Exit:
1. Exit order type:
Limit: execute limit sell order, when the condition is met.
Market: execute market sell order, when the condition is met.
2.Exit Trigger Price (%):
A percentage that will be added to the Exit Trigger Price, and calculated based on Enter Price.
3.Exit Trigger Price:
It’s a specific price that’s calculated from the Exit Trigger Price (%).
4.Exit Price (%):
A percentage that will be added to the Exit Trigger Price, and calculated based on Enter Price.
5.Exit Price:
It’s a specific price that’s calculated from the Exit Trigger Price (%), it’s the exact price that the trade will execute a sell order on.
TP:
1. TP order type:
Limit: execute limit sell order, when the condition is met.
Market: execute market sell order, when the condition is met.
2. TP event: choose the type of the take profit behavior event.
OnPriceHit: execute Sell trade when the price hits TP Price.
OnBarClose: execute Sell trade when a Bar/Candlestick closes above TP price.
3. TP Price (%): a percentage that will be added to the Buy Price, and set in the TP Price.
4. TP Price: it’s a specific price that’s calculated from the Buy Price (%), it’s the exact price that the trade will execute a sell order on. (note: when TP Event is set to OnBarClose then the trade will close at the exact close price of the candle that closed above TP price).
SL:
1. SL order type:
Limit: execute limit sell order, when the condition is met.
Market: execute market sell order, when the condition is met.
2. SL event: choose the type of the stop loss behavior event.
OnPriceHit: execute Sell trade when the price hits SL Price.
OnBarClose: execute Sell trade when a Bar/Candlestick closes below SL Price.
3. SL Price (%): a percentage that will be subtracted from the Buy Price, and set in the SL Price.
4. SL Price: it’s a specific price that’s calculated from the SL Price (%), it’s the exact price that the trade will execute a sell order on. (note: when SL Event is set to OnBarClose then the trade will close at the exact close price of the candle that closed below SL price).
Logs:
Logs prints all necessary information about strategy behavior and orders executions, and it appears in two places: on the TPA in the chart and in the TPA Manager.
TPA manager:
TPA manager is the panel where you can manage all your TPA trades.
Every TPA that has been drawn on any chart will appear in the TPA manager, you can also add new TPA.
Run all will run all TPAs that are listed in TPA manager.
Stop all will stop all TPAs that are listed in TPA manager.
How to save TPA default values:
From the TPA manager right click on the TPA trade you want to save its values as default and then click set as default.
When you save default values or a certain TPA will save all the settings and the percentages .
Pick which field or setting you want to show in the main bar
The Trailing SL feature allows the Stop Loss (SL) order to track price movement, the SL rises with every Bid order, so you can increase the Profit without fear of a price drop.
USDT Quote
PUMP CATCHER is heading to capture any significant rise in the price and not only organized PUMPS, so USDT pairs was added in this update.
Stop Loss
If the price falls immediately after the buy order and the price does not continue to rise, then the SL order is going to be executed at the specified percentage in the field SL, and it can be Market/Limit order, based on your choice.
Market Buy Order
Now you can choose to buy and sell with two types of orders : Limit or Market. When you choose market order then the strategy will execute buy market order exactly when Price Change Percentage gets hit.
Symbols Filter
If you want PUMPS CATCHER to run on specific numbers of pairs, then you added them in Exclusive Pairs. Text is not case sensitive and doesn’t consider spaces between names, just add a comma between each symbol like XLM, bat, zil.
If you don’t want PUMPS CATCHER to catch any movement on a certain symbol, then add them in Excluded Pairs.
If you want to limit PUMPS CATCHER to a certain number of trades, then add this number inPumps Count, so for example if you put “1”, then PUMPS CATCHER will catch the first Pump only, and will not execute any trades for any Pumps after that. And if you put “0”, then it will catch all the Pumps that satisfy your conditions until you stop the strategy manually.
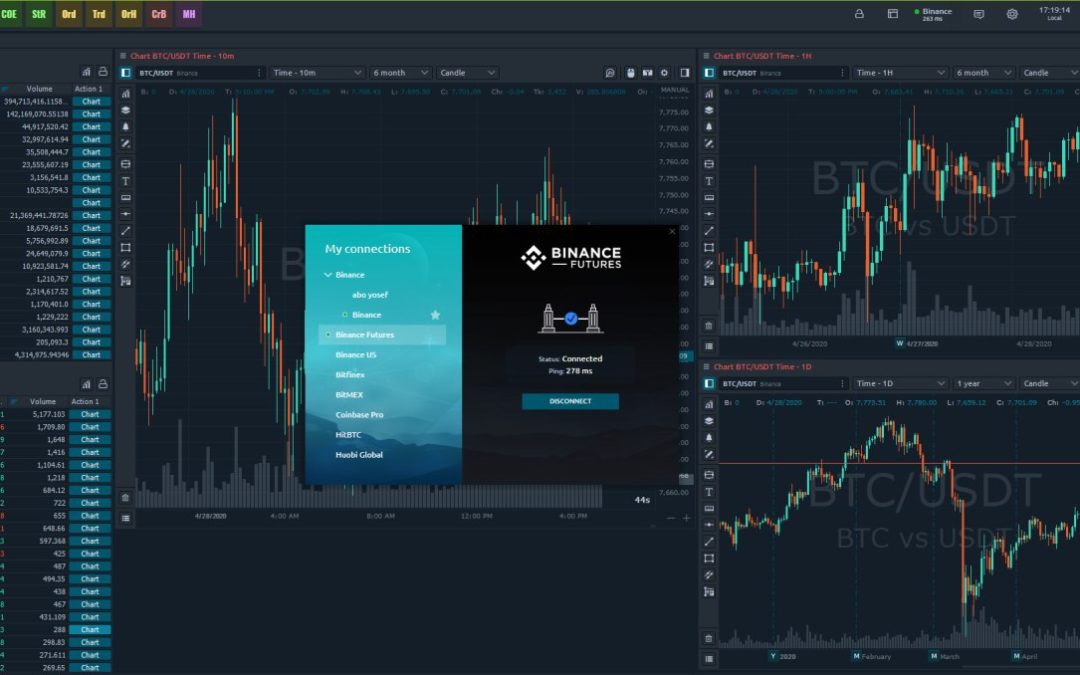
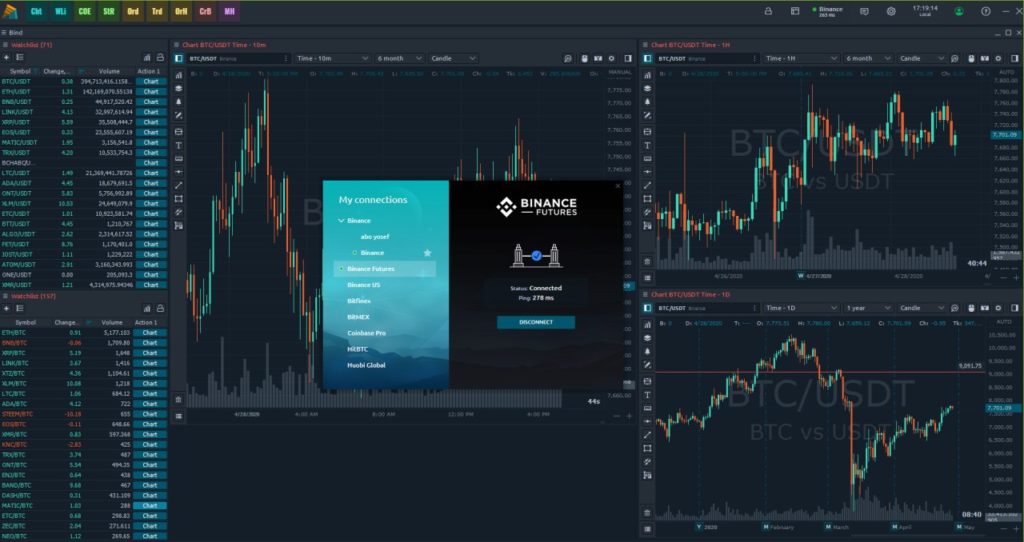
Our team is proud to release the most requested and popular connection, Binance Futures, which allows analyzing and trading futures on the well-known cryptocurrencies. To start trading on Binance Futures via Quantower, just open an account or use your credentials to login to the platform — API Key and Secret Key. If you have any questions regarding the connection, please check our connection guide.
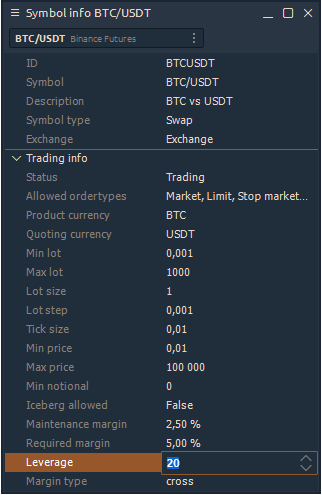
Binance Futures allows you to trade various instruments and manually change the leverage for each one. To change it, open the Symbol Info panel and select the necessary symbol. At the bottom of this panel, there is a Leverage field where you can change the value and apply it by clicking the Enter button.
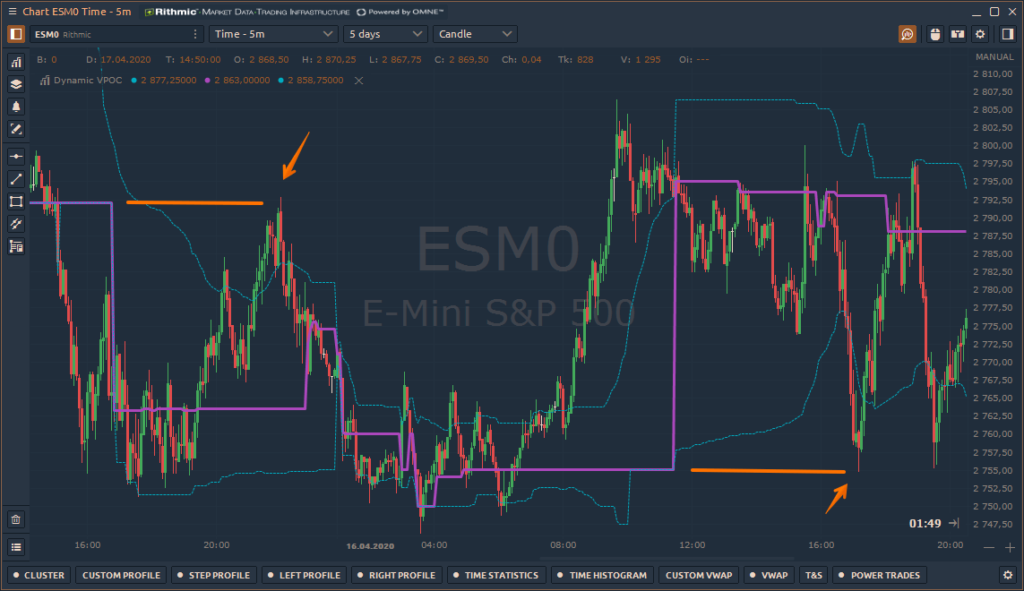
Dynamic VPOC indicator
POC known as Point of Control is the price with the maximum traded volume for the specified time period. At this price, as well as near it, large traders and institutions accumulated their positions and it serves as a very strong reference point for all market participants. Price usually makes quite strong reactions to POC levels. However, you should not blindly focus only on the POC line. It’s vital to apply it with price action methods and reading the current market context.
Dynamic Volume POC indicator shows the change of POC price during the whole trading day. The starting point for calculating the indicator is set from the beginning of the trading day, and the calculation starts again on the next trading day.
Besides the main POC line, the indicator shows the dynamics of the Value Area, which is a range of prices where the majority of trading volume took place. Value Area is set at 70% by default.
Last Bid/Ask Trades in the DOM Trader
Added two new columns called Last Bid & Ask Trades to the DOM Trader panel which shows the recently traded volume for both Bid and Ask separately at the current trading price. One of the main features of these columns is that when several trades executed at the same price, the cell will show cumulative volume. As soon as the price changes and trades are executed at the new price, the data will be written to the new cell and will also accumulate. At the same time, the values at the previous price will remain visible. Thanks to this, you will be able to see absorption or exhaustion at important support and resistance levels, or assess who dominates the market, buyers or sellers.
To activate these columns, right-click on the columns’ header and enable Last Bid/Ask Trades. Also, if necessary, you can clear the accumulated data in these columns by clicking Reset Bid/Ask.
Updates for TPO Chart
New view for TPO Initial Balance
Added a new view for TPO Initial balance in the form of a Bar near the profile. In the profile settings, you can set the view for initial balance as a Bar or as Area. By default, it set in the form of Area (filled letters).
Improved TPO price scale
Changed the behavior of auto-scaling for price scale when the depth of history is changed.
Midpoint shows the middle line of the Market profile. It is
more often used as a support/resistance line or a balanced line for D-shape
profiles.
Cumulative
size in the DOM Trader panel
The new column in the DOM Trader panel, called Cumulative
Size, shows the sum of liquidity at each price level.
Cumulative
Last Trade Size in DOM Trader
Changed the display of the Last Trade Size, which was
located on the price axis. In the new version, we placed Last Trade Size in a
separate column and added a mechanism for accumulating trading volume, if the
price did not change.
For example, if the previous trade was on the Bid side, and
then the latest trade is on the Ask side at the same price, then the Last Trade
Size will add the value. But if the price will change on one tick up or down,
then the Last Trade Size will be reset.
Multiple
custom trading sessions
Trading activity and volatility can vary for each trading
session. And if you need to analyze the distribution of trading volume for
different sessions, it is better to use Custom Trade Session.
In the chart settings, set the time range for one or several
trading sessions and inactive areas will be darkened on the chart. All volume
analysis tools, including Volume Profiles, Clusters, VWAP, on this chart will
calculate the volume data only for the active (specified) range.
Custom trade sessions are available for next panels: Chart, TPO Chart, DOM Trader, DOM Surface
Improved the
management of lists in the Watchlist panel
Watchlist panel allows you to create lists of symbols, save
and switch between them in a couple of clicks. In the latest version, we
improved the list management mechanism by adding two options:
Add to Watchlist option allows you to add a previously saved list to the current list of instruments
Replace Watchlist option clears the current list and adds the previously saved list to the panel