Connection to Binance Futures
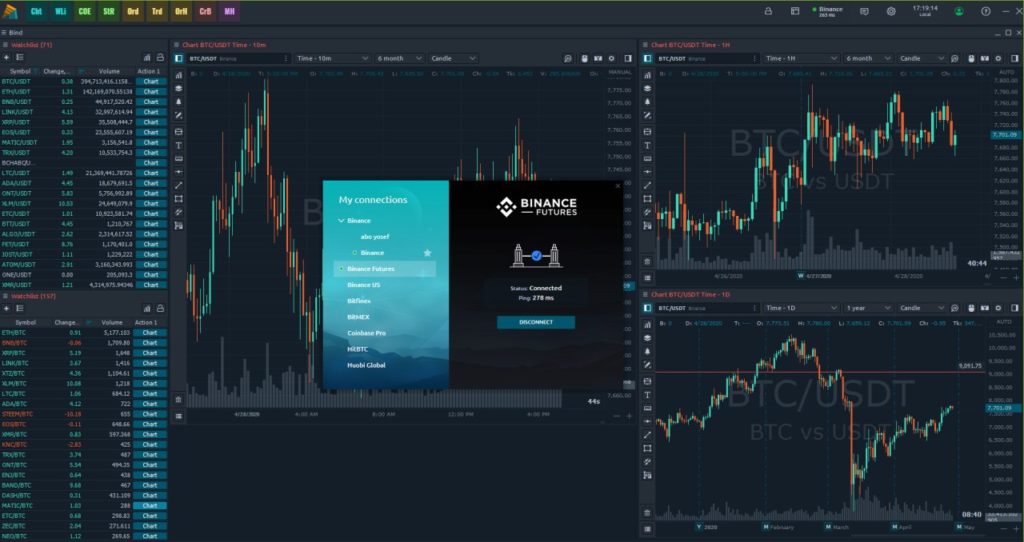
Our team is proud to release the most requested and popular connection, Binance Futures, which allows analyzing and trading futures on the well-known cryptocurrencies. To start trading on Binance Futures via Quantower, just open an account or use your credentials to login to the platform — API Key and Secret Key. If you have any questions regarding the connection, please check our connection guide.
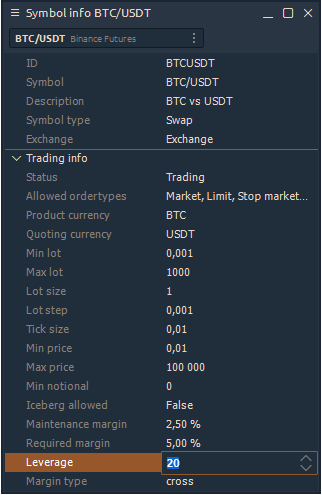
Binance Futures allows you to trade various instruments and manually change the leverage for each one. To change it, open the Symbol Info panel and select the necessary symbol. At the bottom of this panel, there is a Leverage field where you can change the value and apply it by clicking the Enter button.
Dynamic VPOC indicator
POC known as Point of Control is the price with the maximum traded volume for the specified time period. At this price, as well as near it, large traders and institutions accumulated their positions and it serves as a very strong reference point for all market participants. Price usually makes quite strong reactions to POC levels. However, you should not blindly focus only on the POC line. It’s vital to apply it with price action methods and reading the current market context.
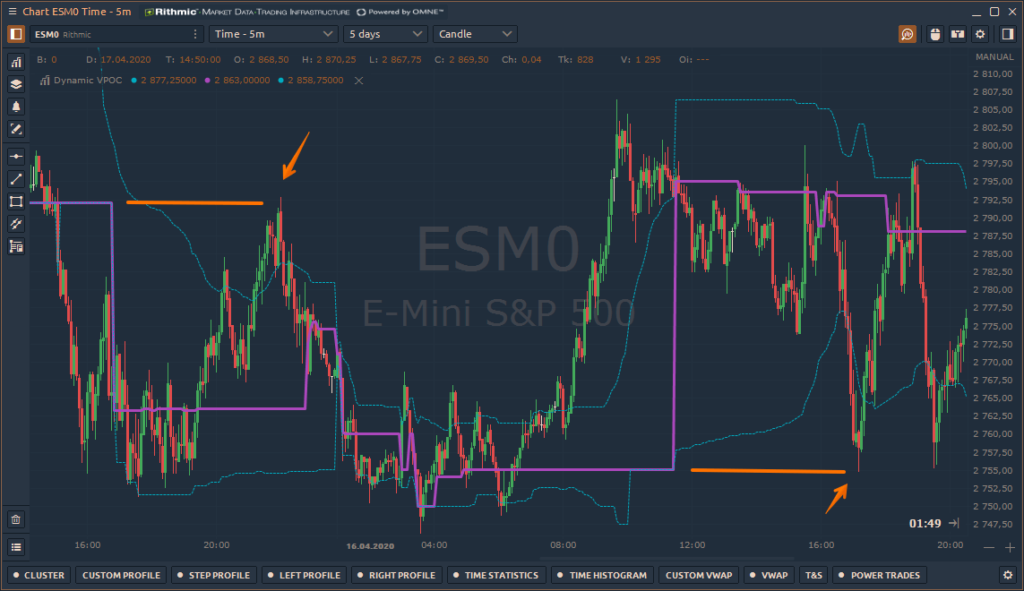
Dynamic Volume POC indicator shows the change of POC price during the whole trading day. The starting point for calculating the indicator is set from the beginning of the trading day, and the calculation starts again on the next trading day.
Besides the main POC line, the indicator shows the dynamics of the Value Area, which is a range of prices where the majority of trading volume took place. Value Area is set at 70% by default.
Last Bid/Ask Trades in the DOM Trader
Added two new columns called Last Bid & Ask Trades to the DOM Trader panel which shows the recently traded volume for both Bid and Ask separately at the current trading price. One of the main features of these columns is that when several trades executed at the same price, the cell will show cumulative volume. As soon as the price changes and trades are executed at the new price, the data will be written to the new cell and will also accumulate. At the same time, the values at the previous price will remain visible. Thanks to this, you will be able to see absorption or exhaustion at important support and resistance levels, or assess who dominates the market, buyers or sellers.
To activate these columns, right-click on the columns’ header and enable Last Bid/Ask Trades. Also, if necessary, you can clear the accumulated data in these columns by clicking Reset Bid/Ask.
Updates for TPO Chart
New view for TPO Initial Balance
Added a new view for TPO Initial balance in the form of a Bar near the profile. In the profile settings, you can set the view for initial balance as a Bar or as Area. By default, it set in the form of Area (filled letters).
Improved TPO price scale
Changed the behavior of auto-scaling for price scale when the depth of history is changed.