Retracement Catcher 1.0

Retracement Catcher 1.0

Retracement Catcher is a trading strategy that involves purchasing an asset at a level of strong demand, or support in the bullish trend and vice versa in the bearish trend.

In the volatile world of cryptocurrency, Retracement Catcher can be a useful tool for traders looking to enter the market at a potentially lower risk point.

In this post, we will introduce a new trading bot that implements a Retracement strategy specifically designed for the crypto market, and discuss how it has been successful in generating profits for its users.


What is Retracement Catcher Bot and how does it work?

Our trading bot, called Retracement Catcher Bot (RCB), uses advanced algorithms to identify key levels of support and resistance in the crypto market and take advantage of them.

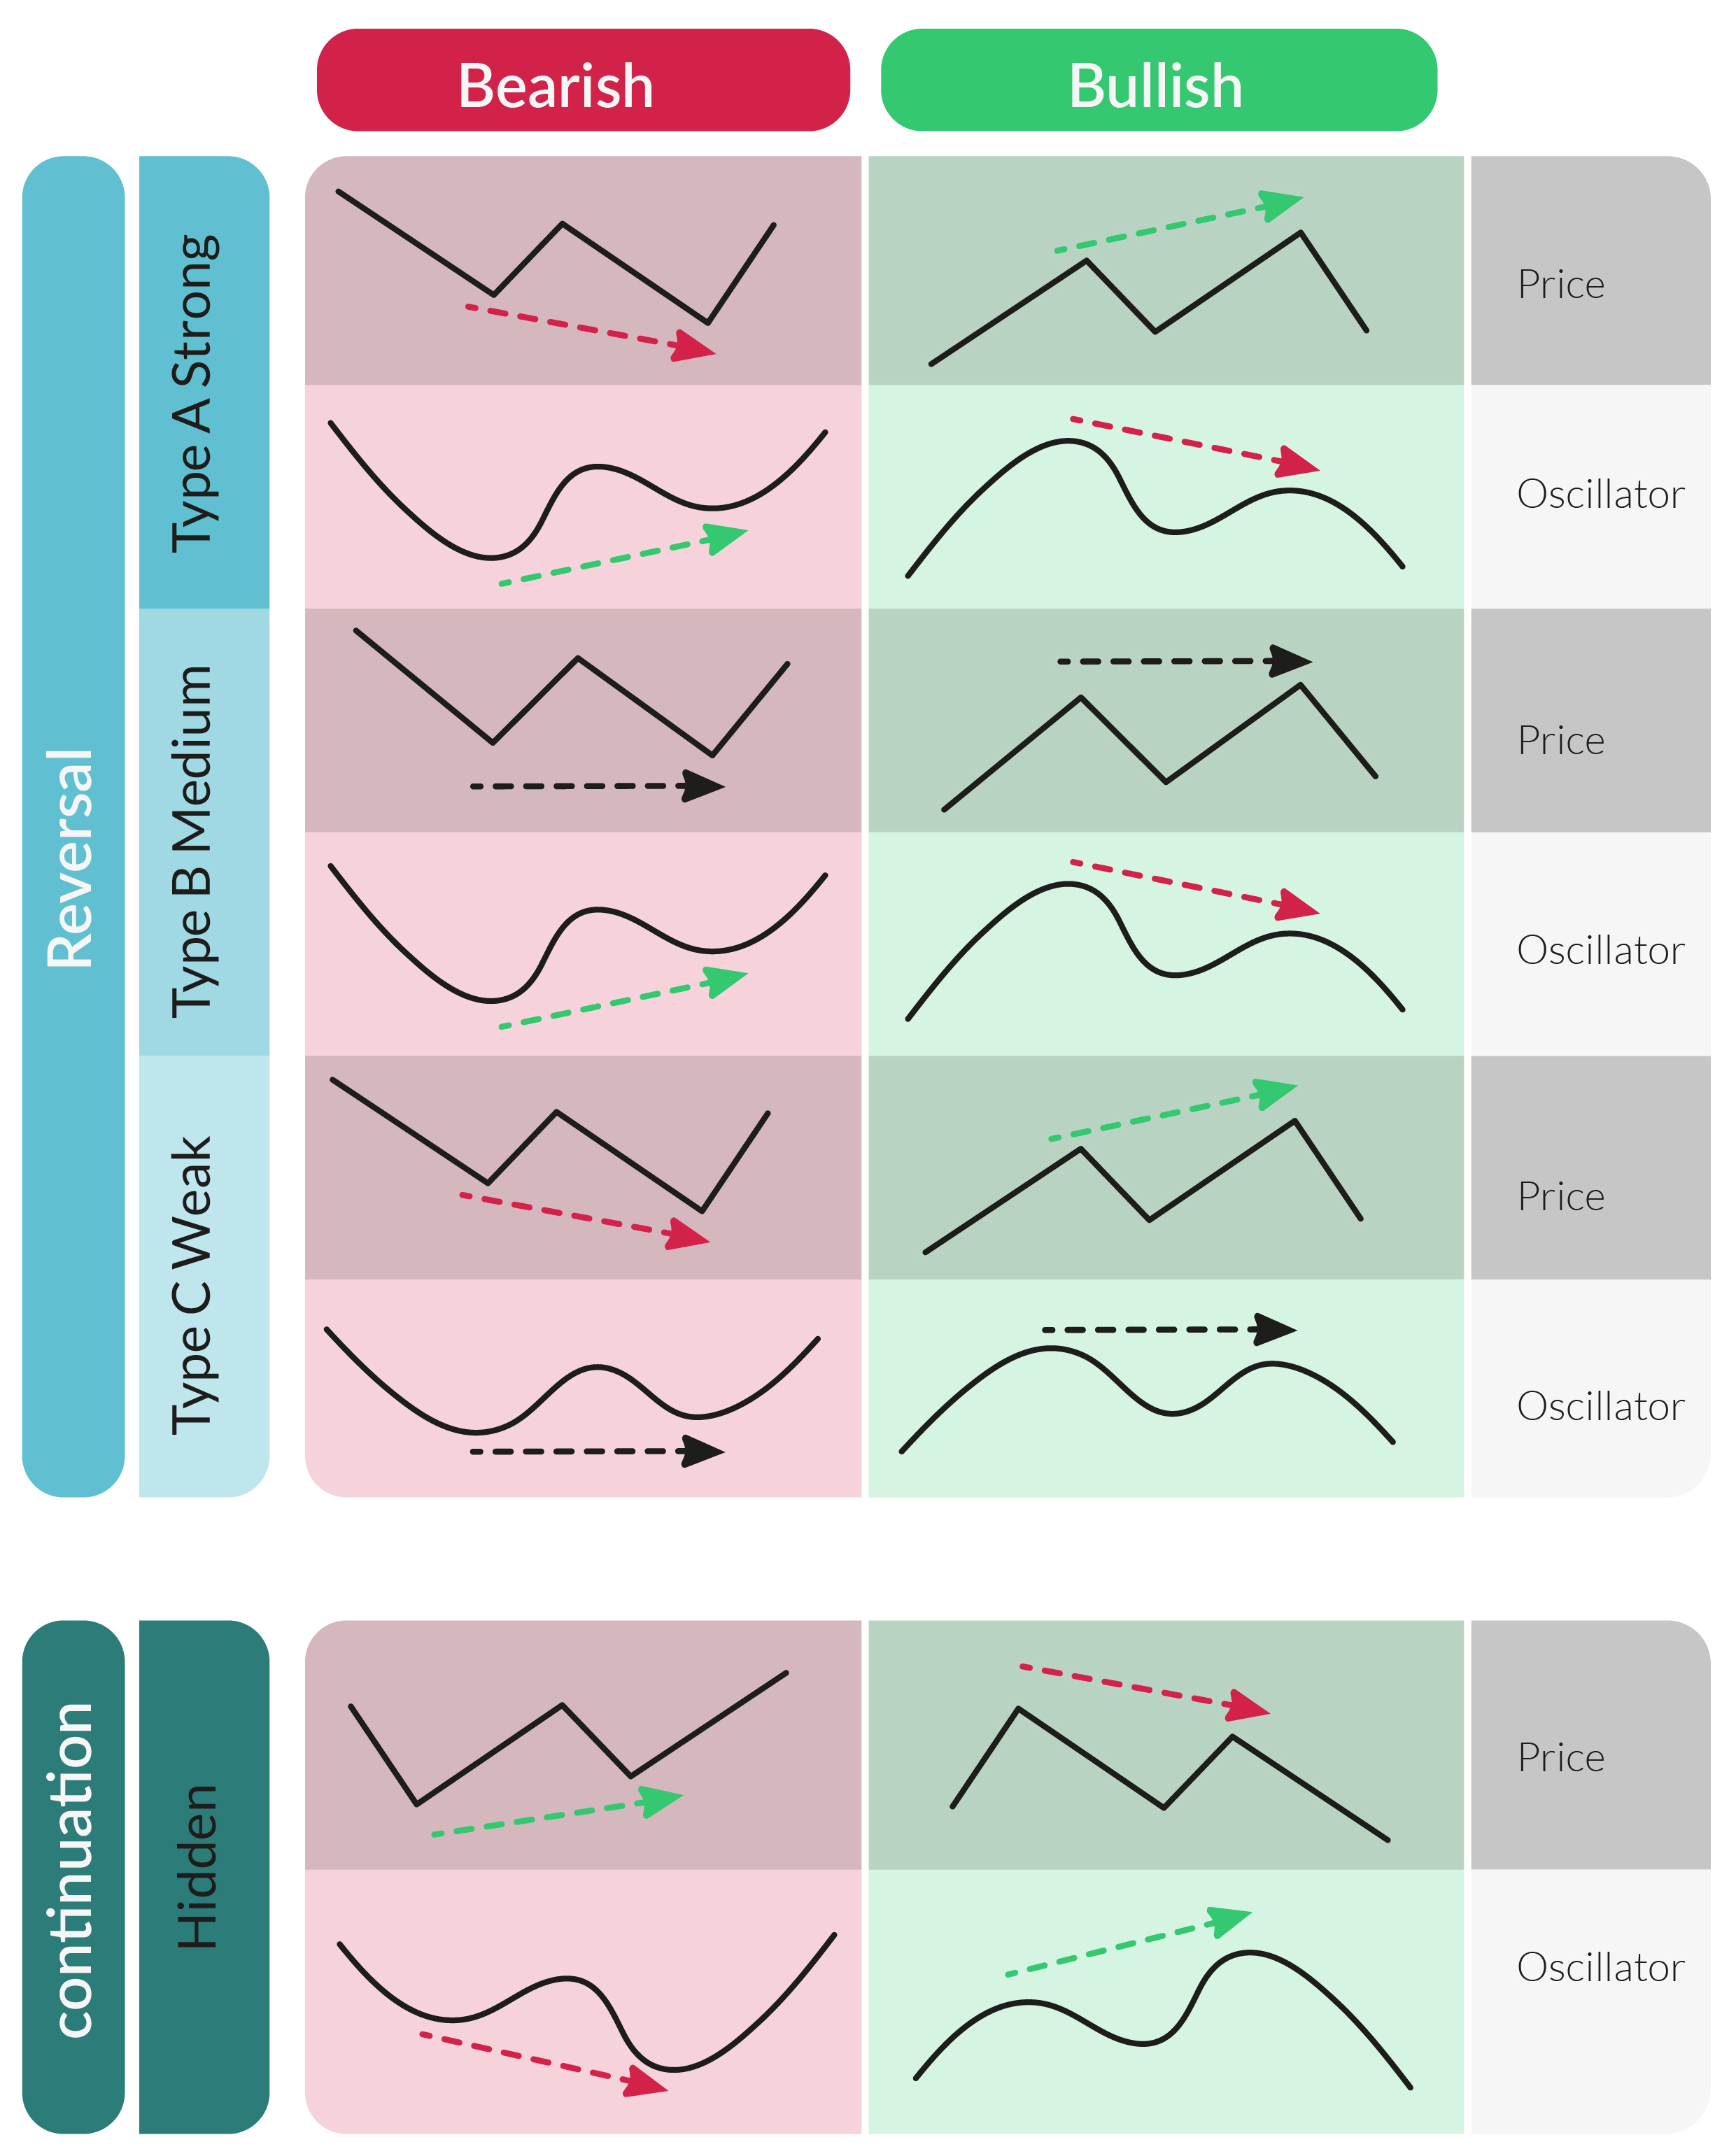
In the bullish scenario, the bot begins by analyzing the trend swings of an asset and identifying strong levels of support, which may indicate a potential pull-back move.

When the bot detects such a move, it adds a second bot called TPA (Trade Personal Assistant) to manage the trade entry, take profit, stop loss, risk management, money management, and exit conditions. The bot can scan all trading pairs on a specific crypto exchange and allows the user to add as many trades as they wish, capitalizing on any potential pull-back action in the market.

The bot also includes customizable parameters, such as the level of risk the user is willing to take and the specific cryptocurrencies they want to trade.

read more about: how it works and how to run it


Examples of Successful Trades:

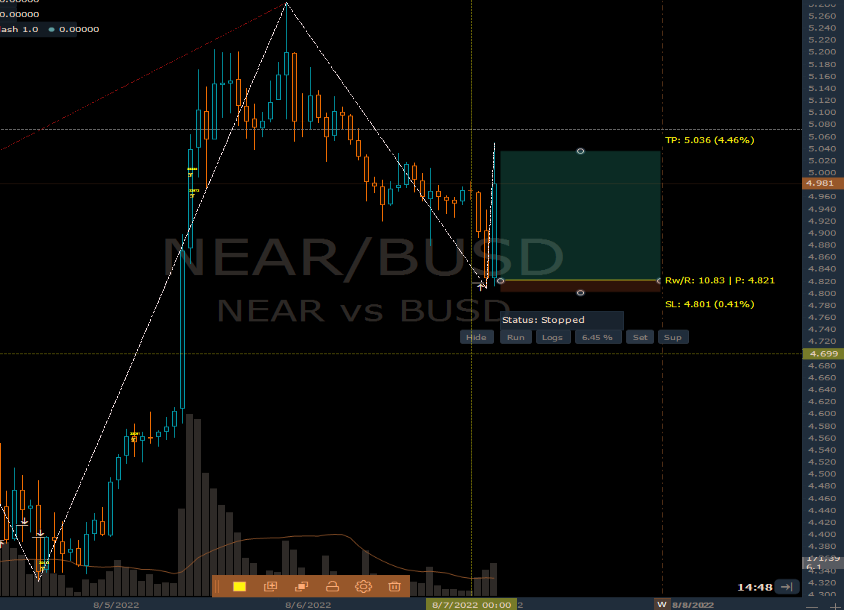
Since its Beta launch, Retracement Catcher has helped its users make numerous successful trades using the buy support strategy. Few examples for trades executed last year: TRB/BUSD +4.7%, NEAR/BUSD +4.4, OG/BUSD +5.3, 


Risks and Limitations:

Like any trading strategy, trading on a pull-back movement carries certain risks and limitations like the down movement can be severe in dump situations and it may last for an extended period of time. It is important for traders to understand that there is no guarantee of profits when using the Retracement Catcher bot or any other trading tool. It is also important to be aware of the inherent volatility of the crypto market and to carefully manage risk and capital when using the bot.


Conclusion:

In conclusion, RCB strategy has been successful in helping its users make profitable trades in the crypto market. While there are always risks involved in trading, the use of a well-designed tool like Retracement Catcher Bot can help traders make informed decisions and potentially increase their chances of success.

RC Bot Documentation >>>

Spider Grid 2.0 (Bot + Scanner)

Spider Grid 2.0 (Bot + Scanner)

Grid trading bots are the most popular trading bots in the cryptocurrency market. Crypto Exchanges start providing a similar bots as a free service because these bots executes so many trades per user, and the more trades executed the more fees they can collect.
However, the majority of these bots is missing important information, which is the best trading pair/symbol in the market to run on.

While traders have limited capital through a limited number of pairs to run grid bots on, traders are always confused about which is the best pair for the grid strategy?

Enter: Spider Grid Scanner

Spider Grid Scanner is a supplementary strategy to Spider Grid Bot 2.0.
It helps to solve this dilemma by scaning the whole trading pairs (ex. USDT pairs) on a certain exchange like Binance, Kucoin, Huobi, OKx, or FTX, to give the best 5 pairs to run the Spider Grid Bot on.

The outcome of the scanning will be the following information:
-Step percentages
-Lower Limit price
-Upper Limit price
-TP price
-SL price

You can pick any of the 5 best pairs, enter the outcome parameters in the Spider Grid Bot, enter the capital per trade, or the total amount of capital for the whole grid, then hit run.
Spider Grid Bot will then keep buying and selling this pair at each level in the specified range until the price hits TP or SL then it will stop.

Spider Grid Bot has two modes.

In the Bullish Mode, when the price hits TP, the bot will just stop. When the price hits SL the bot will stop and sell all sell limit orders at the SL price.

In the Bearish Mode, when the price hits TP, the bot will just stop. When the price hits SL the bot will stop and buy all buy limit orders at the SL price.

The New Divergence Indicator and Strategy

The New Divergence Indicator and Strategy

What is Divergence?

Divergence is when the price of an asset is moving in the opposite direction of a technical indicator, such as an oscillator.

And it warns that the current price trend may be weakening, and could lead to change in the price direction.


What are the best indicators to use for divergence?

In general all oscillator indicators can be used in spotting divergence. We added the most famous indicators that traders use to spot divergence such as RSI, Stochastic, MACD, Momentum, CCI. 

How to use Divergence?

Traders use divergence to assess the likelihood of a price reversal for a certain asset. If the asset price is rising and making new highs, ideally the oscillator is reaching new highs as well. If the asset price is making new highs, but the oscillator starts making lower highs, this warns the price uptrend is weakening and a reversal or pullback is possible. On the other hand, if the asset price is creating lower lows and the oscillator is forming higher lows that indicate the down trend is weakening and reversal can happen.

What is unique about Divergence?

Divergence is considered as a leading indicator even though it uses lagging indicators. What makes divergence a unique signal is that it is not obvious to the naked eye which makes it more valuable to the trader because less people will be able to spot such a signal in the market.

Divergences can help us find better and more reliable trade entries. Divergences can not only be used by reversal traders but also trend-following traders can use divergences to time their exits.

Types of Divergence:

Divergence signals can be categorized based on its direction or its effect direction, and then on its strength.


Regular Divergence (indicate reversals)

Bullish Divergence: Price creates lower low and the indicator creates higher low

Bearish Divergence: Price creates higher high and the indicator creates lower high


Hidden Divergence (indicate continuation)

Bullish Hidden Divergence: Price creates higher low and the indicator creates lower low

Bearish Hidden Divergence: Price creates lower high and the indicator creates higher high


Divergence Classes (strength)

Class A (Strong): both price and indicator divergence lines are steep.

Class B (Medium): Price line is almost straight while indicator line is steep.

Class C (Weak): Indicator line is almost straight while price line is steep.

How to open DivDiv Indicator ?

Gif1

Open DivDiv indicator from the indicators list on the upper left side of the chart panel.

To open the indicator settings just click on the name of the indicator in the sub-window.

DivDiv Indicator settings ?

Gif1

Indicator Base: choose the Oscillator that you want to see the Divergence on it from the list of supported indicators.

Divergence Type: choose between two types of Divergence; the Regular (Reversal) type and the Hidden (Continuation) type.

Confirmation Method:

(None) to see all possible Divergences without any type of confirmation,

(Last Peak) to see only the Divergences that the indicator closes above/below latest peak.

(Max Peak) to see only the Divergences that the indicator closes above/below maximum peak.

Divergence Strength: (explained in the Types of Divergence table above )

(Weak) DivDiv Indicator will show all strength levels of Divergence.

(Medium) DivDiv will show all medium and strong levels of Divergence.

(Strong) DivDiv will Show only strong levels of Divergence.

DivScanner Strategy

Gif1

DivScanner Strategy helps you Scan the Crypto Market for any type of Divergence and send you notification when it finds one.

DivScanner Strategy Settings

Gif1

Value, Build From: choose the timeframe that you want to search Divergences on.

FromDate: choose the starting date and time that Divergences can be drown from.

Divergence Strength, Confirmation Method, Divergence Type: explained in the DivDiv indicator settings.

Quote: choose the Quote that you want to search for Divergences on all pairs belong to that Quote.

Included Pairs*: write Pairs you want to add to the search to the Quote list. ex: you chose Quote=BTC and you want to add ETH/USDT to all BTC Pairs so you write USDT in the Included Pairs.

Excluded Pairs*: write Pairs you want to Exclude from the Quote list.

Exclusive Pairs*: If you want DivScanner to run on specific numbers of pairs, then you added them in Exclusive Pairs. ex: Exclusive Pairs=BTC/USDT, LINK/BTC, ETH/USDT

*Text is not case sensitive and doesn’t consider spaces between symbols, just add a comma between each symbol.

Min Volume: write the minimum 24h volume to filter the Quote search. ex: Quote= BTC, MinVolume= 100.

Max Volume: write the maximum 24h volume to filter the Quote search. ex: Quote= BTC, MaxVolume= 1000.

Gif1

You can also choose which indicators you want to scan for Divergences with DivScanner.

Imbalance  chart

Imbalance chart

Volume Imbalance on the cluster chart

Cluster chart in ThirdDimension platform allows you to see the traded volume at each price level and understands the intentions of traders regarding the future price. In the new version, we have changed the settings and added 3 types of cluster chart: Single, Double and Imbalance.

● Single cluster shows only one data type per each bar.

● Double cluster allows you to select two data types that will be shown in each bar. For example, you can select Volume for the first data type and Delta for the second data type.

● Imbalance in footprint chart highlights the price levels where a buy trade volume is excess over a sell trade volume. Diagonal Bid/Ask imbalance displays aggressive buy market orders lifting the offer and aggressive sell market orders hitting the bid.


In the cluster chart settings, you can specify the ratio between buying and selling volumes diagonally at each price level. For example, Ratio = 3 will show on the chart all the imbalances, where the excess of buying over selling will be above 300%.

Additionally, you can set three different levels of imbalance and specify color settings for each of them.

Stacked Imbalances shows zones of multiple consecutive imbalances that occur on bid or ask side. These zones are important support/resistance levels because they are levels where participants aggressively wanted to get into the market. So when the market retests those levels, the same participants may appear again.

Unfinished auction is also known as unfinished business occurs at bar high/low prices where both buy and sell volumes were traded. The appearance of the unfinished auction indicates a possible continuation of the movement.

Aggregated trades in Time & Sales panel

This new mode in Time & Sales panel, also known as Reconstructed Tape, allows tracking large traders, by summing up trades that match in price, direction and time. For example, if at the price of 2998 single trades were executed at the same time (00:664) and direction (Sell), all trades are summed up.

By setting the additional Time Delay parameter, trades will continue to aggregate at different times, but with the same price and direction.


By adding various conditions for coloring or filtering rows via the Setup Actions menu, you will see only the desired values. Please watch our video guide about this amazing feature and if you have any questions or suggestions, feel free to contact us or leave your comments below.

Connection to Binance Margin

Connection to Binance Margin

Connection to Binance Margin

The new connection extends the list of existing connections to Binance, most of which we have already implemented — Binance Spot, Binance Futures, Binance US. The main difference between Binance Margin and Binance Spot is that traders can borrow funds to increase their deposit before making a trade. This allows traders to expand their opportunities by trading with more instruments.


Account Operations panel

After we have connected Binance Margin, we received many requests to create a special panel, through which traders can transfer funds between their Binance accounts. We liked this idea and created the Account Operations panel.

This panel allows you to perform various operations with a trading account — Funds TransferBorrowRepay. Currently, it works with Binance Margin, Binance Futures and Binance Spot.