Volume Imbalance on the cluster chart
Cluster chart in ThirdDimension platform allows you to see the traded volume at each price level and understands the intentions of traders regarding the future price. In the new version, we have changed the settings and added 3 types of cluster chart: Single, Double and Imbalance.
● Single cluster shows only one data type per each bar.
● Double cluster allows you to select two data types that will be shown in each bar. For example, you can select Volume for the first data type and Delta for the second data type.
● Imbalance in footprint chart highlights the price levels where a buy trade volume is excess over a sell trade volume. Diagonal Bid/Ask imbalance displays aggressive buy market orders lifting the offer and aggressive sell market orders hitting the bid.
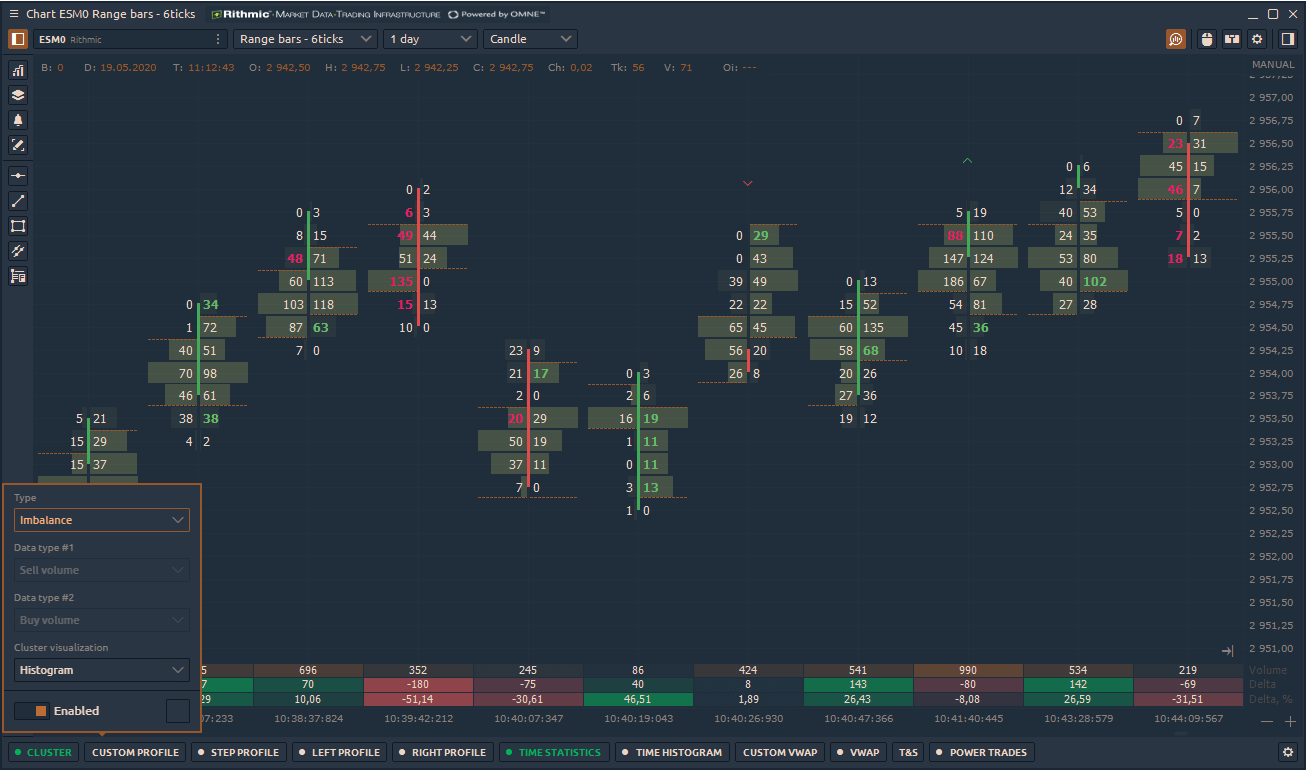
In the cluster chart settings, you can specify the ratio between buying and selling volumes diagonally at each price level. For example, Ratio = 3 will show on the chart all the imbalances, where the excess of buying over selling will be above 300%.
Additionally, you can set three different levels of imbalance and specify color settings for each of them.
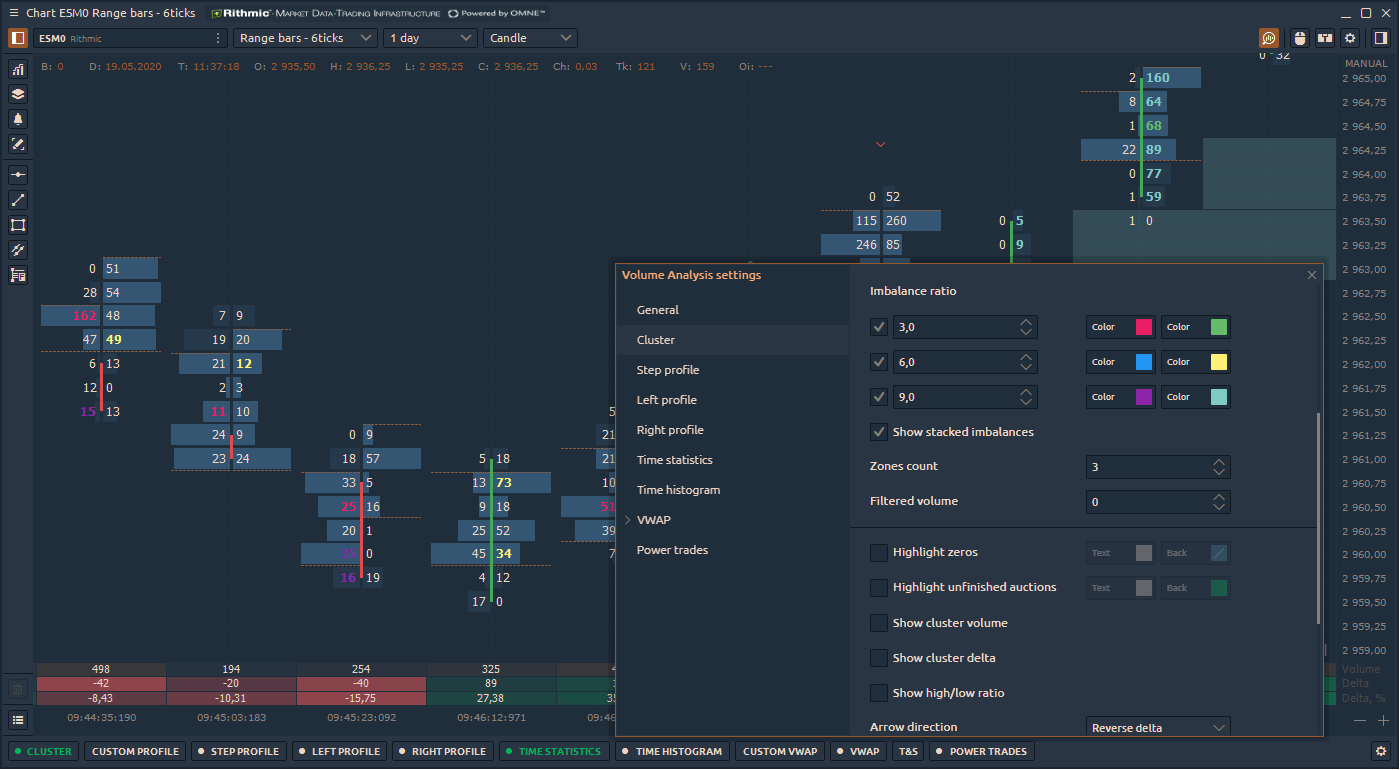
Stacked Imbalances shows zones of multiple consecutive imbalances that occur on bid or ask side. These zones are important support/resistance levels because they are levels where participants aggressively wanted to get into the market. So when the market retests those levels, the same participants may appear again.
Unfinished auction is also known as unfinished business occurs at bar high/low prices where both buy and sell volumes were traded. The appearance of the unfinished auction indicates a possible continuation of the movement.
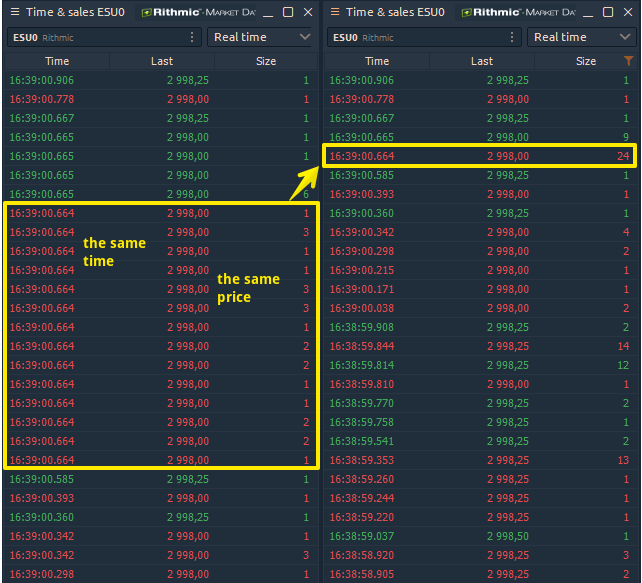
Aggregated trades in Time & Sales panel
This new mode in Time & Sales panel, also known as Reconstructed Tape, allows tracking large traders, by summing up trades that match in price, direction and time. For example, if at the price of 2998 single trades were executed at the same time (00:664) and direction (Sell), all trades are summed up.
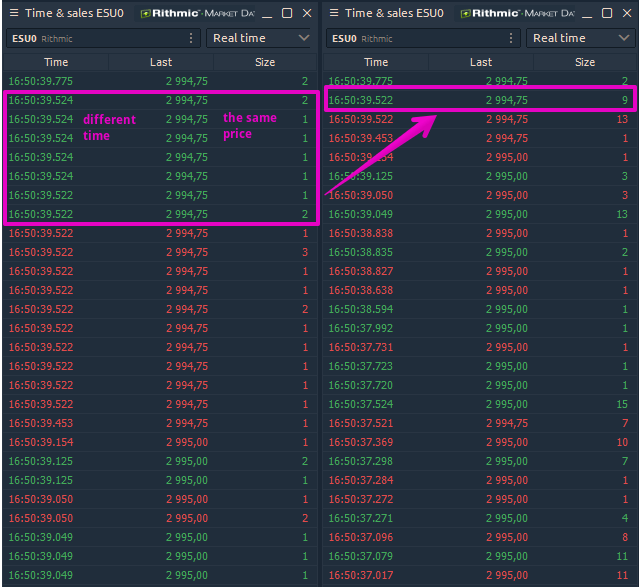
By setting the additional Time Delay parameter, trades will continue to aggregate at different times, but with the same price and direction.
By adding various conditions for coloring or filtering rows via the Setup Actions menu, you will see only the desired values. Please watch our video guide about this amazing feature and if you have any questions or suggestions, feel free to contact us or leave your comments below.