Trading Personal
Assistant – A trader’s best friend
Basic & Advance
parameters walkthrough
A brief explanation of
each combination of strategies
There have been many
instances where we form a strategy in our head, backtest it to see the success
rate and after all the conditions are satisfied we implement it as our trading
style. But even after finding a ‘perfect strategy’ there are a lot of hiccups
in executing it step by step because of several following reasons:
Emotions (One of the biggest reason)
Lack of time to spot the opportunity in the market
Low liquidity in our trading basket – Seed capital gets
locked once we ‘limit order’ some trades
……..and the list goes on. Talking about the biggest money/opportunity
killer i.e., Emotions, we often get taken for a ride by the market makers and
unnecessary FUD (fear, uncertainty & doubt) that challenges our technical
plan of execution and finally tweaks our mindset against the trade.
In 3rd
Dimension, it is possible to remove all the above errors that come into the way
of implementing & executing a strategy. Not only that, but the platform
also helps you to determine certain ‘conditions’ that decreases your chances by
almost 90% from being a victim of ‘Stop hunts’ by Market makers, makes your
trades more profitable and also open gates to several trade opportunities by
not locking your capital by limit orders.
These features are made
possible by our flagship tool – TPA (Trading Personal Assistant).
Meet Trading Personal Assistant – A trader’s
best friend
TPA – Trading Personal Assistant is a modern trading bot that helps you
automate your strategy and eliminate all human errors. TPA is a high frequency
running feature in the 3rd Dimension platform that has 4 entry
parameters which are important for every trader, i.e., buy, sell, take profit
and stop loss.
Taking a deep dive into each parameter
TPA provides these 4
parameters under two heads:
Basic
Advance
Basic
The basic parameters
help the trader define their strategy by providing them with 3 following options:
Resistance breakout
Buy Support
TPnSL
Market Exit
Defining Buy Support & Resistance Breakout
strategies:
Buy support iterates a condition where the trade gets executed only when
the price reaches the level defined by the trader.
Resistance breakout iterates a condition where the trade gets
executed only when the price breaks a certain level defined by the trader.
Both of these
strategies are very useful when more conditions and variables are defined in
Advanced Parameters.
Enhancing Resistance Breakout strategy in Advanced
Parameters:
One of the major key
parameter provided by TPA is defining the Buy
event. Buy event provides the trader with the following conditions:
OnPriceHit
OnPriceHit under Resistance Breakout strategy is a parameter where the entry of the trade happens when
the price hits the entry-level defined by the trader. It is a simple
resistance breakout strategy.
OnBarClose
In this condition, the
entry of the trade happens only when the bar
breaks and closes on or above the entry-level defined by the trader. In T.A, a breakout is said to be valid
only when the concerned timeframe bar closes above a certain level. There are
many times when the price breaks above a certain technical level and retraces
immediately back below the level, trapping most of the traders into the trade.
This phenomenon is called Fake Breakout or fake-out.
OnBarClose eliminates the risk of getting trapped into the fake-outs
and helps the traders to only enter valid resistance breakout trades.
OnBarRetest
This parameter lets the
traders enter the trade only when the following condition is satisfied
Price breaks the level defined by the trader
Bar closes above the said level
The bar goes back and retests the said level
According to T.A when
the price breaks a resistance level, the said level now becomes the support. In
the Resistance Breakout strategy,
most of the traders feel comfortable to only enter the trade when the price
converts a resistance into support and goes down to test the support resulting
in the continuation of the trend.
Never miss opportunities by locking capital in ‘limit
trades’
LocalLimit condition in the Buy
Order Type parameter stands for facilitating trade in the local order book
of 3rd dimension only and not in the actual order book of the
exchange until all the other conditions are satisfied. The trades are only
posted and executed in the actual market order book when the conditions defined
by the trader happens.
While using the Limit condition in the Buy Order Type parameter, the trader
can only post 10 trades in the system (if the capital allotted per trade is 10%
of the portfolio), whereas if LocalLimit
condition is used then the system allows the trader to post more than 10
trades (even if the capital allotted per trade is 10% of the portfolio). So the
merit of using the LocalLimit condition
is it doesn’t reserve your capital and only executes the trade when the
conditions are satisfied.
Manage risk with Sell (Exit) Parameters
Another solution
provided by TPA for risk management is SELL
(EXIT) PARAMETERS. This parameter helps the traders to minimize their risk
by defining the exit condition of the trade.
As mentioned above, a
breakout becomes fake-out when the price retraces below the level which it
originally broke out from. This is the time when the SELL (EXIT) PARAMETERS come into play, it automatically places a
sell limit order at the entry price so that the trades exit the trade with zero
loss.
Let’s explain this with
a hypothetical example:
Without Sell (exit)
parameter: A trader goes long (buy) on BTC/USDT at $7900 (resistance breakout),
he puts the take profit level at $8500 and stop loss level at $7700. Now, the
trade is running until any one of the two conditions are satisfied, i.e. either
the take profit level gets hit, the trader books a profit of $600 or the stop loss level gets hit, the trader
books a loss of $200.
With Sell (exit)
parameter: A trader goes long (buy) on BTC/USDT at $7900 (resistance breakout),
he puts the take profit level at $8500, sell (exit) parameter at $7900 and
stop-loss at $7700. In this case, the trade is running until any one of the three
conditions are satisfied, i.e. either the take profit level gets hit, the
trader books a profit of $600 or the resistance breakout becomes invalid as the
price retraces below the entry price(candle closing below) and the trader gets
out of the trade with ZERO LOSS
Increase profitability with TP Event parameters
Traders must be
familiar with certain events in the market where the price not only hits the
take profit level defined by them but it also goes beyond that level. In these
times, the traders either find themselves in a situation where they feel more
profit could be taken out of the market and sometimes most traders often
re-enter the trade in expectation of a continuation of the trend. This is a
human error as a technically calculated trade is now dominated by the Emotions
of the trader. As you know the answer, the trade always goes against the trader
if emotions are involved.
TPA helps the trader to
not only wipe the emotions out of the trade but also increase profitability in
case the price goes beyond the tp level.
There two options in
the ‘TP Event’ parameter, OnPriceHit
& OnBarClose. OnPriceHit is just
like any traditional take profit parameter where the profit is automatically
booked when the price hits the tp level. Whereas, OnBarClose is a parameter where the profit is automatically booked
when the defined bar not only hits the tp level but also closes above it.
No more Stop Hunts by Market Makers
The very common area to set a stop loss is either a
support zone or a resistance zone, depending upon the direction of the trade. In
the times of extreme volatility, the price often hits the sl first before
continuing in the direction of the trade. In this event, the trader loses the
opportunity to execute a successful trade and even incurs a loss as the sl
level is hit.
To eliminate this issue of stop hunt, traders can
select the option of OnBarClose in
the SL Event parameter. OnBarClose is a condition where the
loss only gets booked if the bar closes on or beyond the stop loss level
defined the trader.
Bonus money management features in the Order Parameter section:
Base quantity
(applied): Base quantity is a simple and standard condition where one can
specify the total amount of the selected asset they want to allot for the
trade.
Quote
Percentage: This condition allows the trader to allot
a certain percentage of his/her capital per trade. Say, a trader has $6789 in
the trading account and he/wants to put 18% of his capital into a trade then he
can simply put 18% as the Quote
Percentage parameter and the assistant will automatically put the
calculated amount of capital in the Base quantity (applied) parameter.
By the numerous requests of our users, we have added Polygon.io that provides Real-time and Historical Market data for Cryptocurrencies, . .
Polygon offers global currency pairs from around the world. Over 1100+ currency pairs streaming in real-time.
Level 1 and Level 2 data from 22 crypto exchanges with coverage of 12+ Crypto Pairs
Connection to Polygon.io data provider
OCO Orders for Binance exchange
A month ago, Binance added support for OCO orders (One-Cancels-Other), which are a group of Limit and Stop-Limit order types. When either one of the orders is executed, the other one is automatically canceled. And when canceling either one of the orders, the entire OCO pair is canceled. In this release, we have also added this type of order for our users.
How to create an OCO order on Binance?
For Buy OCO order, the price for limit order < current market price. Also, the trigger stop price > market price.
For Sell OCO order, the price for limit order > current market price. Also, the trigger stop price < market price.
Select OCO from the drop-down list of orders, then specify the price of the Limit order, as well as the price trigger for the stop order and the price of the limit for the stop-limit order. Specify the order volume, then click the Buy (or Sell) button to place the order.
Placing OCO orders on Binance exchange
New indicator Delta-Rotations
The Delta-Rotations indicator plots in real-time the accumulated aggressive orders of the market participants on each rotational move through the delta. As a result, it allows the detection of shifts between supply and demand through the relation of the height of the bars to their corresponding price and the elapsed time.
Delta Rotations indicator in 3rdDimension platform
In the case of an up move (upward trend), the long elongated structural move will show sustained demand through considerably high bars. On the other hand, pullbacks will show relatively low supply through a shorter rotational move represented by lower selling aggression.
Higher moves with decreasing overall demand (declining delta rotations) show exhaustion through reducing buying pressure and are signs of potential reversals.
The same concepts apply for down moves with dominating supply/selling aggression and decreasing demand/buy aggression.
Custom Tick Size for DOM Trader
In the previous release, we have already added custom Tick Size for Chart and DOM Surface panels. Now it is available for DOM Trader panel as well. For those who missed the previous release, we remind you that this setting “aligns” all levels in DOM to the required tick size.
For example, some data providers and exchanges do not provide the minimum value by which the price of a trading instrument changes. As a result, the price scale uses the wrong value of the price, creating gaps.
Take a look at three screenshots. On the left without Custom Tick Size, on the middle screenshot with this setting. If the tick size is set higher than the minimum or specified by the exchange, the Level2 data will be aggregated like on the right screenshot
Custom Tick Size in DOM Trader panel
Added Elliot triangle Wave, Triangle pattern, Three Drives pattern
Elliot triangle Wave
Elliot Wave is a popular theory in technical analysis, which is based on the cyclical behavior of the price. Using Elliot Wave drawing, you can graphically identify the waves to determine the correction or trend reversal.
Elliot triangle wave drawing in 3rdDimension platform
In the drawing settings, you can select the type of wave marker to indicate different types of waves on one chart — Cycle, Primary, Intermediate etc.
Settings of the Elliot Wave drawing
Triangle pattern
Triangles are a popular technical pattern that analysts frequently use to anticipate potential price reversals. The Triangle Pattern drawing tool allows you to plot four points (A, B, C, D) in order to overlay a triangle onto the candlesticks of a price chart. The idea is to place the points on four alternating highs and lows. That is to say, points A and C would be on consecutive highs (or lows) and B and D would then be on consecutive lows (or highs).
Triangle pattern drawing in 3rdDimension platform
Three Drives pattern
The Three Drives Pattern is a well-known harmonic chart pattern that consists of a series of three higher highs or lower lows, which signals a potential reversal.
In the classical bullish version of this pattern, there are three drives or pushes in the upward direction. After each push, there is a retracement of 0.618 Fibonacci retracements of the previous drive.
The next drive needs to end near the 1.272 Fibonacci extensions for the price action to qualify for the pattern. When the price gets close to the drive 3 point at the 1.272 extension, you would put in an order to sell.
Three Drives Pattern drawing in 3rdDimension platform
Your target would be the 0.618 retracement of the entire move from point zero to the top of drive 3.
Then, of course, the classical bearish pattern is the same thing, but upside down.
The new color scheme for the cluster chart will allow experienced traders to define more precisely the places and levels with a large volume, number of trades and delta. This is very similar to filtering, which at a given value of the cluster will apply the necessary color.
As an example, let’s see how it works on ES futures.
Go to the chart settings and select the desired data type on which to build the cluster. Then select Custom coloring in Cluster Visualization. Additional color settings will appear for the three cluster levels. At the first level, we will set 1000 contracts in one cluster, at the second 2000 and at the third 5000. For each level, set green, blue and red colors, respectively. If you zoom out the chart, then due to the color filtering we can see clusters with large volumes, i.e. zones of high interest.
Connection to Huobi Global crypto exchange
Added a new trading connection to the popular Huobi Global cryptocurrency exchange. This exchange offers traders 200+ cryptocurrencies and 500+ trading pairs. As for other crypto exchanges, here we also added two connection modes:
Info, allows you to connect without an API Key and make the necessary analysis of the selected cryptocurrency.
Trading mode. Requires unique API & Secret Keys to perform trading operations.
Custom Tick Size for Chart and DOM Surface panels
This setting allows you to “align” the chart to the desired tick size. For example, some data providers and exchanges do not provide the minimum value by which the price of a trading instrument changes. As a result, the price scale uses the wrong value of the price, creating gaps. This is especially noticeable on the Order Flow or DOM Surface charts. Using this setting, you can more accurately set the minimum price change and get the correct price display.
Added the function of minimizing a panel
Any open panel, group or bind can be minimized to the taskbar by clicking Minimize button. This function is quite simple and allows you to more conveniently work with open panels.
Changed the calculation of tick directions for Binance
We improved the mechanism for calculating tick directions, which is involved in volume tools. Earlier, when a new trade executed, if the price did not change, then the volume of this trade we referred to the None category and it did not refer to Buy or Sell. As a result, the total volume of trades marked None reached 50% of the total trading volume. Now, if a new trade has the same price as the previous trade, it is assigned a category, like the previous trade.
3rdDimension 1.39 supports Real-Time Data (RTD) function for sending data and other market information to Microsoft Excel®. This feature opens up many opportunities for creating custom displays and other ways to better manage your workflow. For instance, you can transmit real-time market data, account info and analyze it on your own. You can use our example Excel file to evaluate RTD possibilities. Also, read our help guide on how to activate RTD and how to work with it in Excel.
Binance got an Info Mode. Access to real-time market data without a trading account
The Info Mode lets you connect to the Binance exchange without using the API key, and receive real-time data for all available cryptocurrencies. This mode will be useful for a complete analysis of the market situation, including with the help of Volume Analysis Tools, Order Flow, and various chart types.
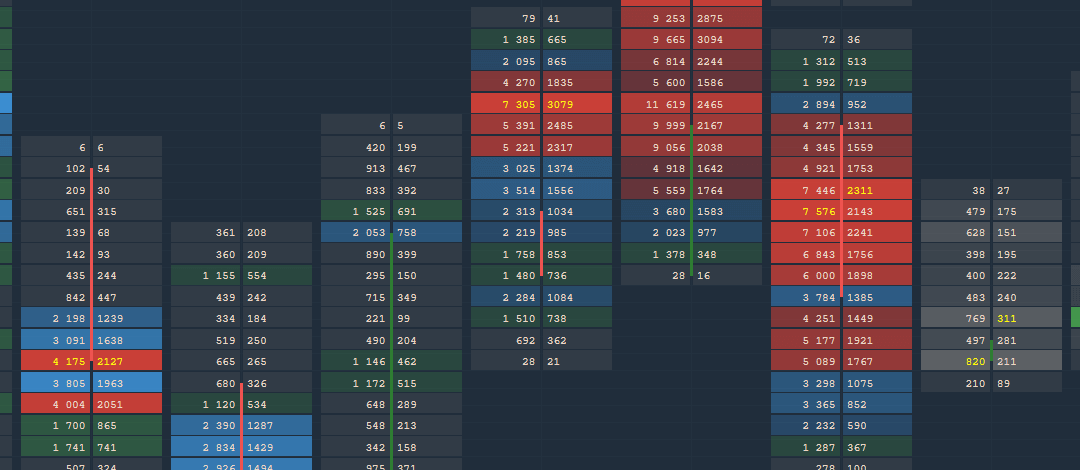
Power Trades Scanner got predefined settings templates
In order for Power Trades to work properly, it is important to set the parameters that will best suit the specific symbol. Therefore, to make it easy to use the scanner, we have prepared predefined setup templates for 36 instruments traded on the Binance exchange. These settings are the starting point for the use of Power Trades, and every user can set more precise parameters on their own.
So, the screenshot below shows the list of symbols for which we have prepared templates.
Level 2 Indicator
The indicator shows DOM levels with volumes at each price level directly on the chart. This allows you to monitor changes in the DOM without having to open the panel itself. In the settings of the indicator, you can specify the required number of levels, colors, as well as the width of the occupied area on the chart.
Indicator of Separated ATRs
This is a volatility indicator that shows the difference between the two ATR indicators:
the first ATR takes into account only the growing bars
the second ATR only counts falling bars.
Symbol Description on the chart
On the background of the chart, we have added the name of the trading instrument, which you can optionally enable/disable in the general settings of the panel.
One of the great new features, that was developed based on a traders feedback — an abbreviation of crypto prices. This feature allows you to apply a special “shortening” for prices of Crypto-symbols only, resulting in “useless zeros” removal. The algorithm is simple — we just hide all “0” symbols from the left side of price and replace with “..”, for example, 0.0000145 -> ..145. This feature applies globally for all crypto-symbols in application thus changes price values in all panels.
Indicators data in watchlist filters/alerts
Another great advice from our community lead us to develop a possibility to use calculated values of indicators in Watchlist filtering & alerts. Old 3rdDimension traders already know about the possibility to add indicators in Watchlist and see their values in separate columns. Now you can use that values in Table actions functionality (Settings -> Setup actions) to filter rows of call an alert. This simple and yet powerful possibility is available starting from Free version of 3rdDimension .
Omni trend indicator
The Omni Trend indicator (based on the NRTR indicator by Konstantin Kopyrkin) is a trend indicator that uses Average True Range & Moving Average to generate trading signals: buy — when price reaches the previous high & sell — when the price below the previous low.
NRMA indicator
Another interesting indicator that might tell you when go long or short — NRMA indicator. It consists of dots, placed around the price, that suggest bearish (dots are above) or bullish (dots are below) price actions. You can find a lot of information on best practices for this indicator on the internet, but in short: buy when dots are below the price and sell when they are above.