The New Divergence Indicator and Strategy

The New Divergence Indicator and Strategy

What is Divergence?

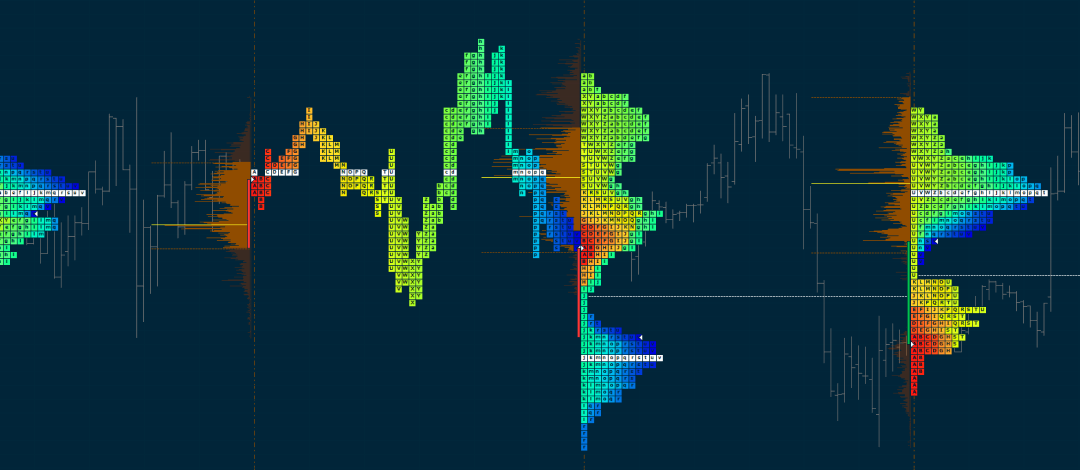
Divergence is when the price of an asset is moving in the opposite direction of a technical indicator, such as an oscillator.

And it warns that the current price trend may be weakening, and could lead to change in the price direction.


What are the best indicators to use for divergence?

In general all oscillator indicators can be used in spotting divergence. We added the most famous indicators that traders use to spot divergence such as RSI, Stochastic, MACD, Momentum, CCI. 

How to use Divergence?

Traders use divergence to assess the likelihood of a price reversal for a certain asset. If the asset price is rising and making new highs, ideally the oscillator is reaching new highs as well. If the asset price is making new highs, but the oscillator starts making lower highs, this warns the price uptrend is weakening and a reversal or pullback is possible. On the other hand, if the asset price is creating lower lows and the oscillator is forming higher lows that indicate the down trend is weakening and reversal can happen.

What is unique about Divergence?

Divergence is considered as a leading indicator even though it uses lagging indicators. What makes divergence a unique signal is that it is not obvious to the naked eye which makes it more valuable to the trader because less people will be able to spot such a signal in the market.

Divergences can help us find better and more reliable trade entries. Divergences can not only be used by reversal traders but also trend-following traders can use divergences to time their exits.

Types of Divergence:

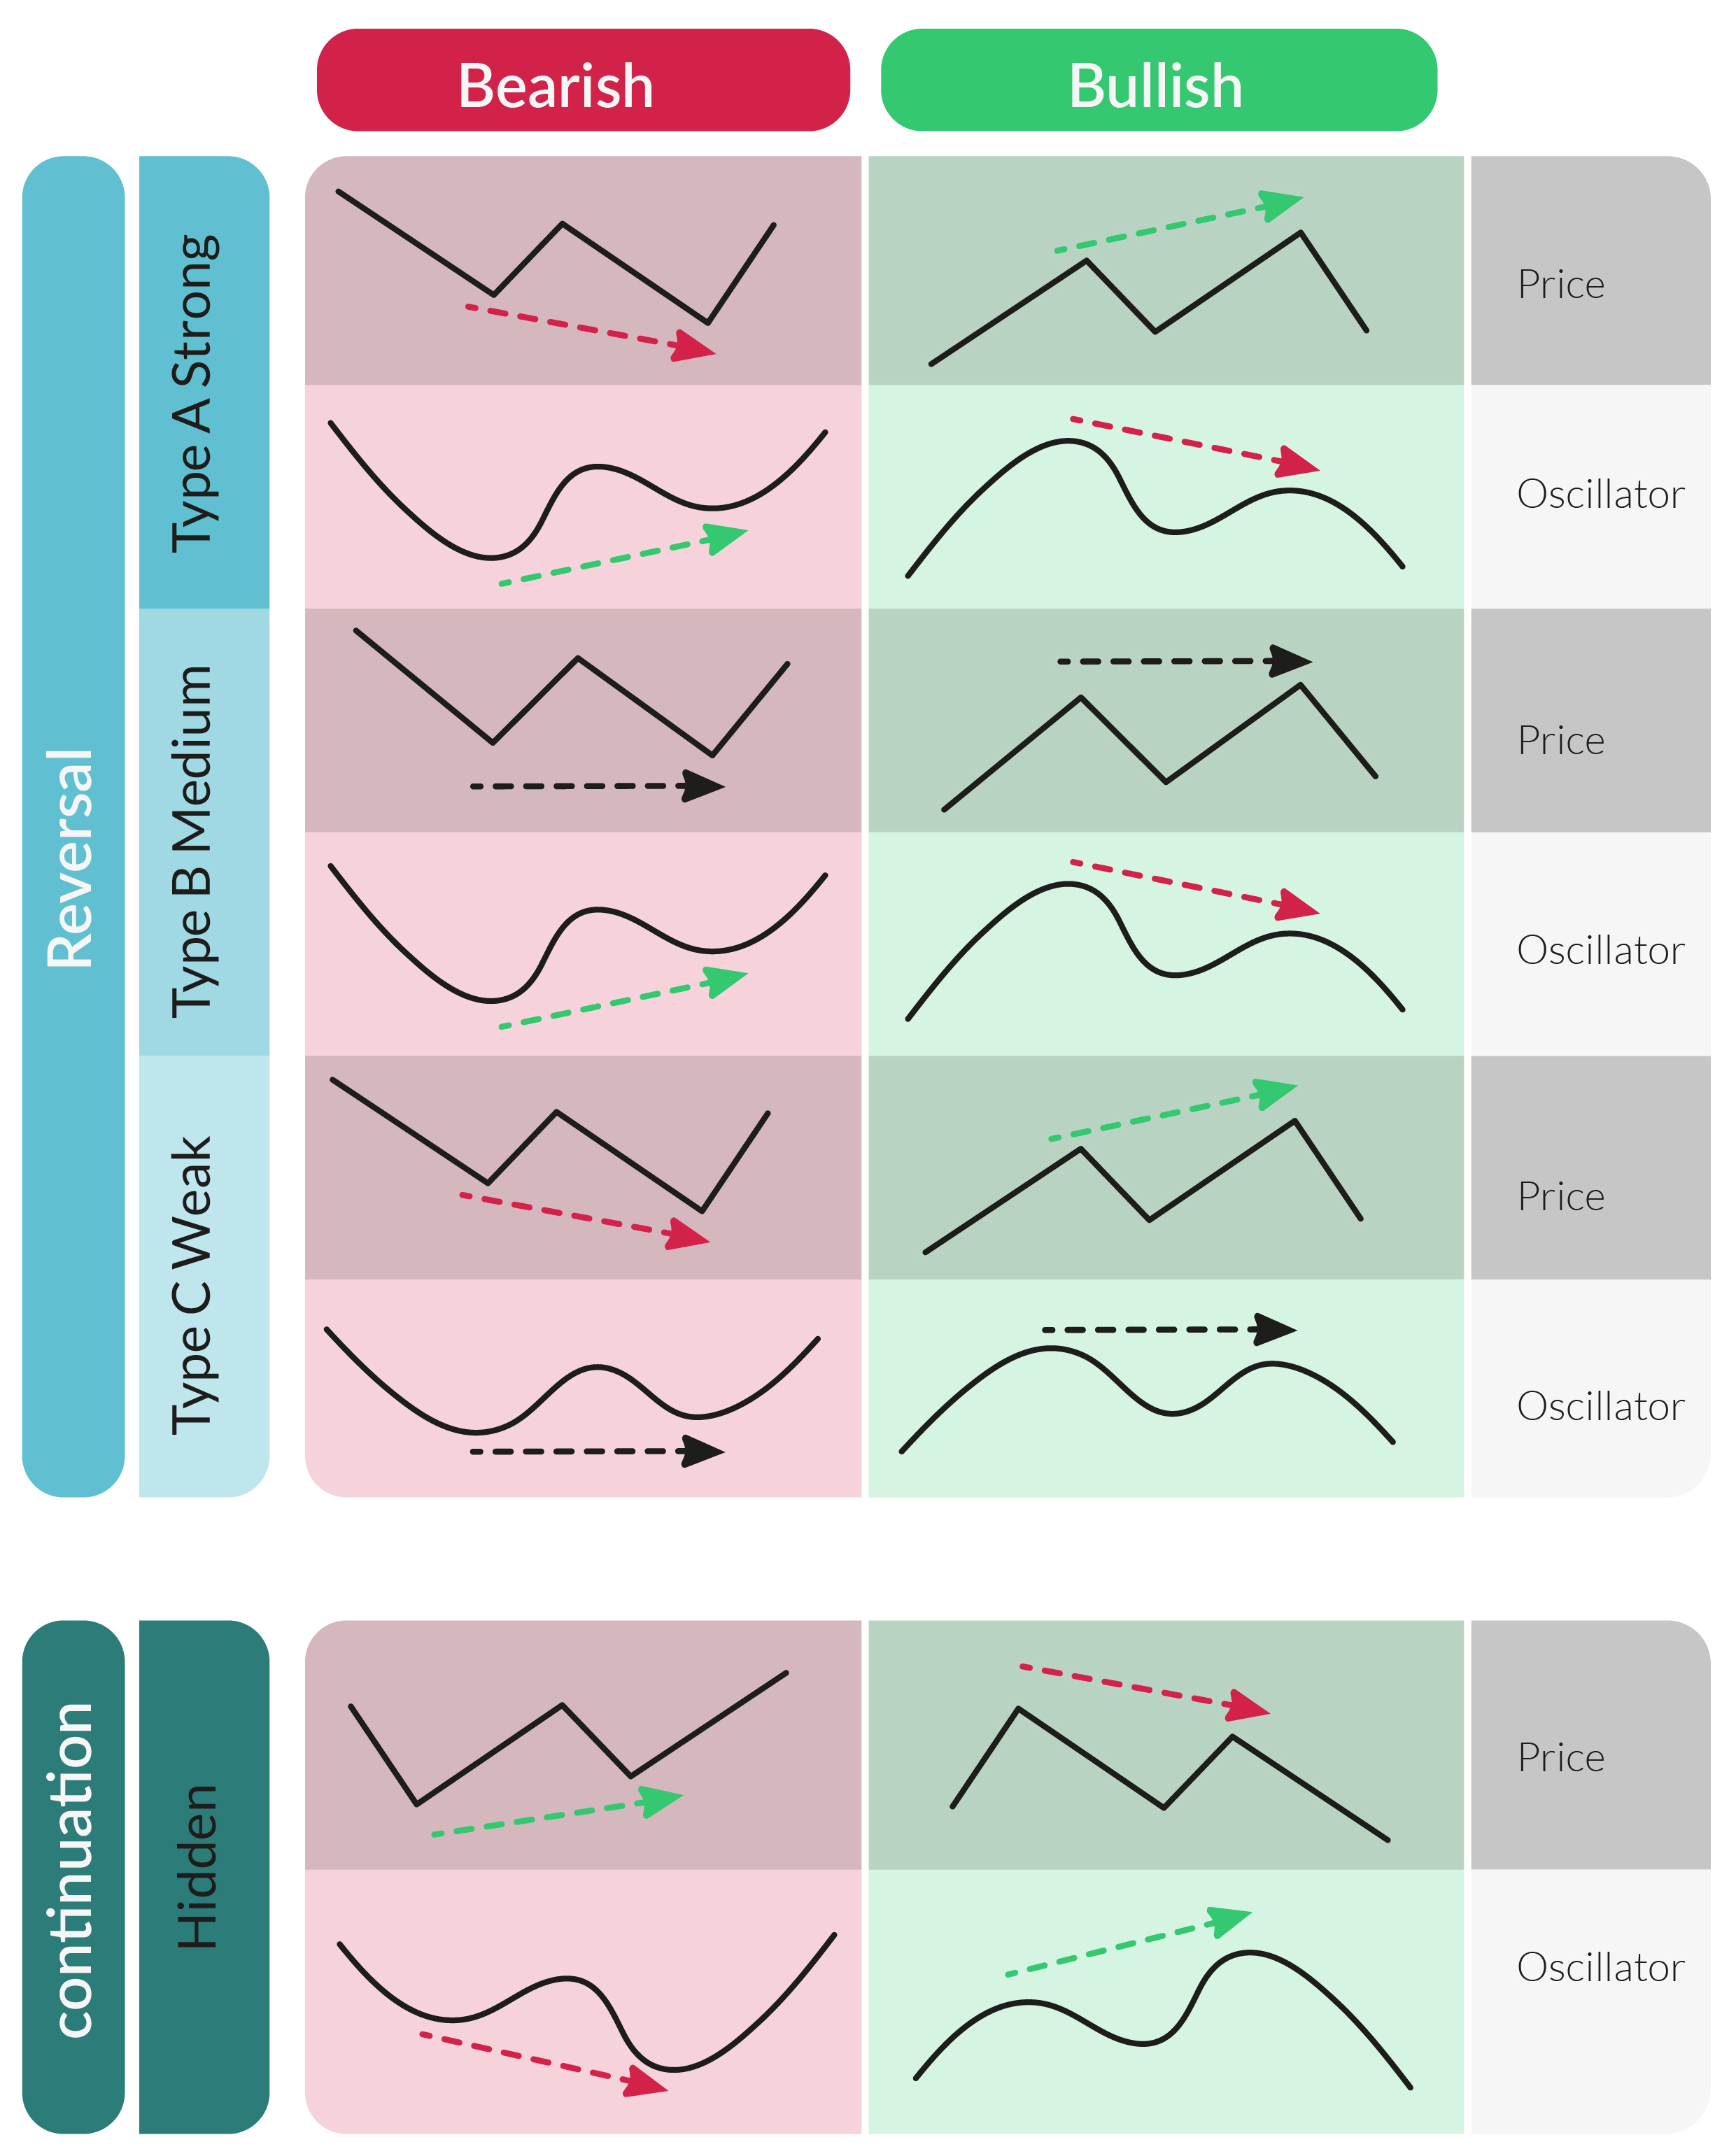
Divergence signals can be categorized based on its direction or its effect direction, and then on its strength.


Regular Divergence (indicate reversals)

Bullish Divergence: Price creates lower low and the indicator creates higher low

Bearish Divergence: Price creates higher high and the indicator creates lower high


Hidden Divergence (indicate continuation)

Bullish Hidden Divergence: Price creates higher low and the indicator creates lower low

Bearish Hidden Divergence: Price creates lower high and the indicator creates higher high


Divergence Classes (strength)

Class A (Strong): both price and indicator divergence lines are steep.

Class B (Medium): Price line is almost straight while indicator line is steep.

Class C (Weak): Indicator line is almost straight while price line is steep.

How to open DivDiv Indicator ?

Gif1

Open DivDiv indicator from the indicators list on the upper left side of the chart panel.

To open the indicator settings just click on the name of the indicator in the sub-window.

DivDiv Indicator settings ?

Gif1

Indicator Base: choose the Oscillator that you want to see the Divergence on it from the list of supported indicators.

Divergence Type: choose between two types of Divergence; the Regular (Reversal) type and the Hidden (Continuation) type.

Confirmation Method:

(None) to see all possible Divergences without any type of confirmation,

(Last Peak) to see only the Divergences that the indicator closes above/below latest peak.

(Max Peak) to see only the Divergences that the indicator closes above/below maximum peak.

Divergence Strength: (explained in the Types of Divergence table above )

(Weak) DivDiv Indicator will show all strength levels of Divergence.

(Medium) DivDiv will show all medium and strong levels of Divergence.

(Strong) DivDiv will Show only strong levels of Divergence.

DivScanner Strategy

Gif1

DivScanner Strategy helps you Scan the Crypto Market for any type of Divergence and send you notification when it finds one.

DivScanner Strategy Settings

Gif1

Value, Build From: choose the timeframe that you want to search Divergences on.

FromDate: choose the starting date and time that Divergences can be drown from.

Divergence Strength, Confirmation Method, Divergence Type: explained in the DivDiv indicator settings.

Quote: choose the Quote that you want to search for Divergences on all pairs belong to that Quote.

Included Pairs*: write Pairs you want to add to the search to the Quote list. ex: you chose Quote=BTC and you want to add ETH/USDT to all BTC Pairs so you write USDT in the Included Pairs.

Excluded Pairs*: write Pairs you want to Exclude from the Quote list.

Exclusive Pairs*: If you want DivScanner to run on specific numbers of pairs, then you added them in Exclusive Pairs. ex: Exclusive Pairs=BTC/USDT, LINK/BTC, ETH/USDT

*Text is not case sensitive and doesn’t consider spaces between symbols, just add a comma between each symbol.

Min Volume: write the minimum 24h volume to filter the Quote search. ex: Quote= BTC, MinVolume= 100.

Max Volume: write the maximum 24h volume to filter the Quote search. ex: Quote= BTC, MaxVolume= 1000.

Gif1

You can also choose which indicators you want to scan for Divergences with DivScanner.

Imbalance  chart

Imbalance chart

Volume Imbalance on the cluster chart

Cluster chart in ThirdDimension platform allows you to see the traded volume at each price level and understands the intentions of traders regarding the future price. In the new version, we have changed the settings and added 3 types of cluster chart: Single, Double and Imbalance.

● Single cluster shows only one data type per each bar.

● Double cluster allows you to select two data types that will be shown in each bar. For example, you can select Volume for the first data type and Delta for the second data type.

● Imbalance in footprint chart highlights the price levels where a buy trade volume is excess over a sell trade volume. Diagonal Bid/Ask imbalance displays aggressive buy market orders lifting the offer and aggressive sell market orders hitting the bid.


In the cluster chart settings, you can specify the ratio between buying and selling volumes diagonally at each price level. For example, Ratio = 3 will show on the chart all the imbalances, where the excess of buying over selling will be above 300%.

Additionally, you can set three different levels of imbalance and specify color settings for each of them.

Stacked Imbalances shows zones of multiple consecutive imbalances that occur on bid or ask side. These zones are important support/resistance levels because they are levels where participants aggressively wanted to get into the market. So when the market retests those levels, the same participants may appear again.

Unfinished auction is also known as unfinished business occurs at bar high/low prices where both buy and sell volumes were traded. The appearance of the unfinished auction indicates a possible continuation of the movement.

Aggregated trades in Time & Sales panel

This new mode in Time & Sales panel, also known as Reconstructed Tape, allows tracking large traders, by summing up trades that match in price, direction and time. For example, if at the price of 2998 single trades were executed at the same time (00:664) and direction (Sell), all trades are summed up.

By setting the additional Time Delay parameter, trades will continue to aggregate at different times, but with the same price and direction.


By adding various conditions for coloring or filtering rows via the Setup Actions menu, you will see only the desired values. Please watch our video guide about this amazing feature and if you have any questions or suggestions, feel free to contact us or leave your comments below.

Connection to Binance Margin

Connection to Binance Margin

Connection to Binance Margin

The new connection extends the list of existing connections to Binance, most of which we have already implemented — Binance Spot, Binance Futures, Binance US. The main difference between Binance Margin and Binance Spot is that traders can borrow funds to increase their deposit before making a trade. This allows traders to expand their opportunities by trading with more instruments.


Account Operations panel

After we have connected Binance Margin, we received many requests to create a special panel, through which traders can transfer funds between their Binance accounts. We liked this idea and created the Account Operations panel.

This panel allows you to perform various operations with a trading account — Funds TransferBorrowRepay. Currently, it works with Binance Margin, Binance Futures and Binance Spot.

DOM Trader improvements

DOM Trader improvements

Trading & visual improvements in DOM Trader panel

We’re always working hard to make ThirdDimension better and especially its main trading panels like DOM Trader. For the last month, hotkeys, visual changes, and improved performance have been added to this panel!

● Added Total Rows for Bids, Asks, Buy and Sell columns. This row shows the total number of placed orders at different prices that are outside the visibility area. In addition, it shows the sum of limit orders at Bid and Ask side, allowing to estimate the imbalance between buyers and sellers.

● Added the ability to change Custom tick size “on the fly” by holding Ctrl key and scrolling the mouse wheel.

● Added the ability to set the number of levels for Bid/Ask columns.

● Added the Ctrl+Q hotkey that will call a small window where you can quickly change the Order Quantity.

● Ctrl+1, Ctrl+2, etc. hotkeys will apply predefined Order Quantity from the list. This list can be changed in the panel settings by specifying the necessary order sizes or adding more buttons.

● Added a new confirmation that will ask about closing the panel. This option will save from accidental panel closing.

● Visual marker of the size for a new order. In case of accidental changes in the order size, you will notice with what volume the new order will be set.

● Increased speed of placing, modifying, and canceling orders with Rithmic connection.

DOM Trader improvements

Added a tooltip that shows the size of the order that trader is going to place. This will allow hiding the order entry sidebar, focus only on the trading process and always understand the order size that will be placed in the market.

Also, for Binance and Binance futures we have improved the Cancel Orders function, which will cancel all orders simultaneously (!). For those who actively trade cryptocurrencies and place a large number of orders, this option will speed up the cancellation of working orders.

Hope you enjoy the new Imbalance feature, and let us know what you think! Leave your questions and feedback and our team will be happy to help!

Connection to CTS technology

Cunningham Trading Systems (CTS) is a technology that provides access to many of the world’s largest exchanges for trading futures, options. In fact, it is the same trading connection as Rithmic, with a wide coverage of exchanges and brokers.

Improved DOM Trader panel with Slim mode

All major changes can be grouped into two categories: visual changes, new columns & features.

Updated UI for Order Entry sidebar

Thanks to close cooperation with professional traders, we have made many visual changes for the Order Entry sidebar. Firstly, it became 30% smaller and we also added Slim mode which reduces the size of the sidebar by 60% (!). For traders who have DOM as their main trading panel, this compact view will be appreciated. In addition, for even more space savings, you can remove signatures of some fields using the No Labels option.

Drag & Drop columns

Another important change we’ve implemented in the panel is the resizing and dragging of all the columns to any location. As a result, each trader will be able to customize the appearance of the panel at his own discretion.

Quick quantity buttons improvements

Surely many of you are already familiar with Quick quantity buttons, on which you can set any order volume. In the new version, we have added support for mathematical signs before the values to quickly increase, decrease or reset the current value.


 Liquidity changes column (known as Pulling and Stacking)

Pulling and Stacking describe the summary of the Liquidity Order Book (LOB) for Bid and Ask Side separately. Stacking shows an increasing Volume in the Order Book for the Sell-Side (Ask) or Buy-Side (Bid) and reflects therefore a supportive intention for the price to move in the corresponding direction. Whereas the Pulling shows a decrease in the Volume in the Order Book and therefore a lack of interest.

If you are considering a short position, buyers pulling bids and sellers stacking offers can provide a trigger for a trade.

If you are considering a long position, buyers stacking the bids and sellers pulling the offers can provide a trigger for a trade.

Number of changes and Cumulative changes columns

Number of changes shows how many times the values have changed at a particular price level (Bids x Asks). Cumulative changes shows the total volume that changed at a specific price level since the panel launched.

Why Number of Changes and Cumulative changes are important?

The liquidity on the Depth of market is constantly changing due to very different types of reasons. The fast changes occurring simultaneously on the bid and ask side are very difficult to track with the naked eye. It becomes even worse when you have over 10 levels.

This is the part where the number of changes and cumulative changes comes on handy. For a buy trade, you would expect to see an increasing number of changes combined to higher cumulative changes showing increasingly adding liquidity at a higher pace. Even better, would it be combined to a higher cumulative change on the ask side to the downside, showing participants eager pulling out the liquidity.

In addition, all three columns have several reset modes:

  • manual reset of every single column via the context menu
  • automatic reset after a certain time or after a specified number of ticks.

Flexible position management in Option Analytics

Position and strategy management in the Option Analytics panel has become more flexible, thanks to a quick selection of strikes, a reversal button of a single strike or a strategy, and increased volume. In addition, when adding several different strategies, you can quickly include or exclude the entire strategy or a single strike from the profile analysis mode.

 Trailing Stop order with Rithmic

After launching bracket and OCO orders for Rithmic several months ago, we made further improvements to our advanced order types. Trailing Stop is now available on ThirdDimension platform with Rithmic to better help you automate trades and mitigate risk. This order type tracks the current price against the existing position. Once the price is on a positive side for you, the stop order moves closer, reducing the risk.


Introducing visual implementation of TPA strategy – Plan and execute your trade visually

Introducing visual implementation of TPA strategy – Plan and execute your trade visually

We have recently added a feature that helps traders plan, draft and execute their trade visually with the help of our commonly used strategy, TPA or Trading Personal Assistant. By default, traders had to go through the options provided on the top left corner of the screen.

3RD DIMENSION LOGO > TRADING > STRATEGY RUNNER (StR) > SELECT STRATEGY > TPA

Before we explain the particulars of our newly added feature, let’s revisit the concept of Trading Personal Assistant. What is Trading Personal Assistant?

TPA – Trading Personal Assistant is a modern trading bot that helps you automate your strategy and eliminate all human errors. TPA is a high frequency running feature in the 3rd Dimension platform that has 4 entry parameters which are important for every trader, i.e., buy, sell, take profit and stop loss.

Read More in Brief here: http://thirddimension.exchange/what-is-trade-personal-assistant-tpa/

Implementing TPA visually

By default, the TPA strategy is embedded under Drawings Library option. We can add it permanently on the left corner objects bar just by selecting a small ‘star’ button on the right side of the TPA option. See the below screenshot:

Using the TPA Button: After selecting the TPA button all we need to do is to go over the charts and start drawing out respective trade plans on the candles. With this feature our trade will be up and running within 3 seconds.

Example: The current price of bitcoin at the time of writing this article is $8082. Let’s assume that a trader wants to enter a trade at $8100 with a take profit level at $8800 and stop loss level at $7800. The trader can execute this plan in less than 3 seconds by – selecting TPA strategy from the left corner objects bar > Clicking on the entry price on the chart and then adjusting the TP & SL levels > Mention %age of your account balance for each strategy (default: 0%) > Run

See screenshot:

Next level trading with these 4 TPA parameters

Before clicking Run, traders can specify unique trading conditions with the help of the 4 different strategies coming under TPA strategy, they are:

  • Resistance breakout
  • Buy Support
  • TPnSL
  • Market Exit

Read More in brief about each parameter here: http://thirddimension.exchange/what-is-trade-personal-assistant-tpa/

TPO Profile chart and Trading on BitMEX exchange. Check out new features!

TPO Profile chart and Trading on BitMEX exchange. Check out new features!

Here at Quantower, we continue to develop new features, add more connections and of course new panels for your better trading. Therefore, in this release, we are super excited to present a completely new panel — TPO Chart.

Trading on BitMEX exchange

Previously, we’ve connected to BitMEX crypto exchange and it lets you analyze digital currencies and futures in Info mode. This allowed you to use BitMEX data without the API & Secret Keys. 

So today we are happy to announce that we’ve added Trading on BitMEX. Now you are able to enter your personal API Key & Secret Key to trade main cryptocurrencies and their futures.

TPO Profile Chart (a.k.a. Market Profile®)

Time Price Opportunity or TPO Chart, shows the price distribution during the specified time, thus forming a profile. This allows you to understand at which levels or ranges the price has spent the most time, as well as to determine the main support and resistance levels.

Let’s take a look at the most interesting points of the TPO chart panel

Building a TPO Profile for any time period

The base element of the TPO chart is letters that are used to build the market profile structure. Each letter initially represents a half-hour period. Quantower offers to specify in the aggregation settings any values on the basis of which the profile will be built. For example, a daily profile of 30-minute bars is considered as a “standard”. But you can set a lower value of “Build From” and the profile will be more granular. Conversely, set the value higher and the shape of the profile will be smoother.

10 coloring modes for profile visualization

Choose any color scheme for better representation and analysis of the TPO profile. Currently, there are 10 different coloring modes available — Single Color, Up/Down Profile, Up/Down Bars, Heatmap, Delta Profile, Delta Price, Delta Bars, Volume Profile, Volume Price, Volume Bars.

Key elements of TPO Profile — POC, Value Area, Singles

In the profile style settings, enable the main elements for precise analysis:

Point of Control (POC) — price level of the greatest market activity or trading volume. At this level, the price spent most time over the profile range.

Value Area — price range in which approximately 68% – 70% of the market activity or trading volume took place.

Singles or single prints of the profile are placed in the middle of a profile structure, not at the upper or lower edge. They occur on impulse movements and are used as support/resistance zones, which the price can test in the near future. The singles line indicates where the singles begin to form (in cases when there are several single prints).


Overlaying the standard chart over the TPO Profile

In the Style settings of TPO Profile enable the “Plot Symbol” option for displaying the standard chart and apply any drawings for technical analysis.


Splitting & Merging the TPO Chart

Use splitting for a detailed analysis of profile formation. There are two splitting modes available in the platform:

  • Split full profile, that separates the profile into each bar or TPO;
  • Divide by bar, that splits the profile in half on the selected bar.

To separate TPO, select the necessary profile and click on the Split button (or use right-click to open the context menu)

Merge is a feature that combines several profiles into one. Right-click on the selected profile to open the context menu and select Merge Left or Merge Right. To return profiles to their original positions, press the Reset button.


Using Volume Analysis tools

TPO profiles are used on their own to find areas of support and resistance, and can also be used in conjunction with volume profiles. For this, we have added Volume Analysis control to the top toolbar of the panel. Here you can select the data type and show/hide the POC & Value Area.


In addition, we have left our standard volume analysis tools, which let you add Time Statistics & Histogram for bar analysis, VWAP, and other tools.

Setting the Session Time 

Set the custom time range for the necessary trading session and the profile will be built within this range. The rest of the time the profile will not take into account


TPO Profile chart panel is available as a separate license as well as for all users with the All-in-One license.

Access to 3d-party extension “Trading Personal Assistant (TPA)”

Every day our trading platform becomes popular not only among individual traders but also among community leaders. As a result, they start to develop their own trading systems and plug-ins.

We are glad to inform you that now on our website on the Pricing page of the separate category there are extensions of our partners. At the moment, the Trading Personal Assistant (TPA) extension is available, which was developed by the 3rd Dimension team. More details about TPA and how it works, please read on their website.