One of the great new features, that was developed based on a traders feedback — an abbreviation of crypto prices. This feature allows you to apply a special “shortening” for prices of Crypto-symbols only, resulting in “useless zeros” removal. The algorithm is simple — we just hide all “0” symbols from the left side of price and replace with “..”, for example, 0.0000145 -> ..145. This feature applies globally for all crypto-symbols in application thus changes price values in all panels.
Indicators data in watchlist filters/alerts
Another great advice from our community lead us to develop a possibility to use calculated values of indicators in Watchlist filtering & alerts. Old 3rdDimension traders already know about the possibility to add indicators in Watchlist and see their values in separate columns. Now you can use that values in Table actions functionality (Settings -> Setup actions) to filter rows of call an alert. This simple and yet powerful possibility is available starting from Free version of 3rdDimension .
Omni trend indicator
The Omni Trend indicator (based on the NRTR indicator by Konstantin Kopyrkin) is a trend indicator that uses Average True Range & Moving Average to generate trading signals: buy — when price reaches the previous high & sell — when the price below the previous low.
NRMA indicator
Another interesting indicator that might tell you when go long or short — NRMA indicator. It consists of dots, placed around the price, that suggest bearish (dots are above) or bullish (dots are below) price actions. You can find a lot of information on best practices for this indicator on the internet, but in short: buy when dots are below the price and sell when they are above.
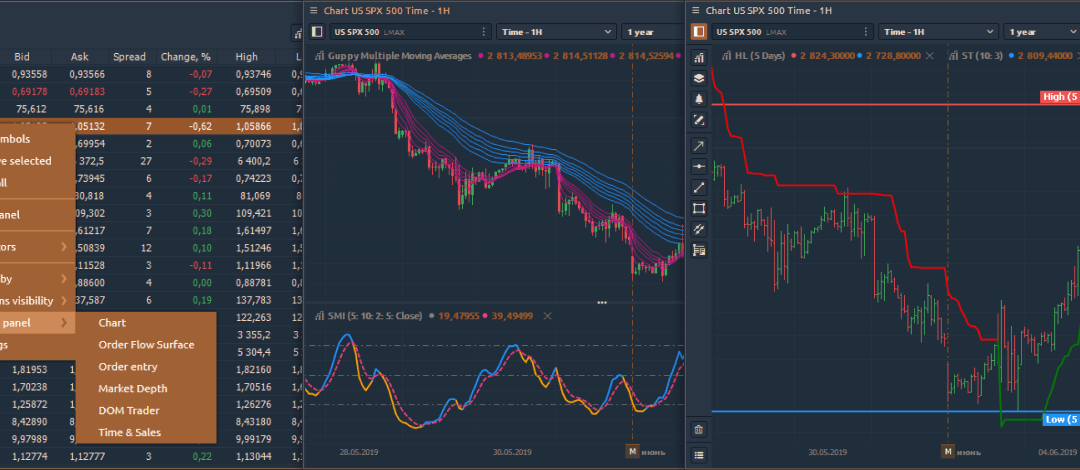
At the request of our customers, we added a list of new technical indicators:
Donchian Channel
High/Low indicator
Super Trend indicator
Ichimoku indicator
Pivot Points
Stochastic momentum index
Guppy Multiple moving averages
Triple Exponential Averages
Improvements in Watchlist panel
Creating a new panel from Watchlist
We’ve added the option to quickly open a new panel for the selected symbol from Watchlist. When you right-click on a symbol, you will see the list with 6 available panels: Chart, Order Flow, Order Entry (or Crypto Order Entry), Market Depth, DOM Trader, Time & Sales.
Manual sorting of the list of instruments in Watchlist
After adding symbols to Watchlist, users can sort or filter the list by each column. In this version, we have added drag and drop of individual rows to any location on the list for full customization.
Quick lock of the Watchlist
This option will protect Watchlist from accidental sorting, deletion of columns or cleaning of the whole list after its setting up. Activation and deactivation of this mode are performed by clicking on the “Lock” icon on the Watchlist panel, as well as from the panel’s context menu.
Search news in the RSS panel
Navigation in the RSS panel has become easier by the search mechanism for news on the required company or a specific event. Enter the company name in the search field and all related news will be filtered.
Improved Symbol Lookup Search Engine
For searching a trading instrument in the Symbol Lookup, you can now enter not only the ticker but also the name and description of the asset. This simplifies the search in cases if you do not know the exact ticker of the trading instrument. The system searches for both one word and a group of words in any order separated by a space.
Thank you for choosing our trading software! In this short guide, we will tell you how to install 3rd Dimension and start trading immediately. Let us tell you about the main differences between our “installation process” and default Windows® install process, that most users are accustomed to.
Firstly, 3rd Dimension does not copy it’s files to the system folders (AppData or Program Files) of the OS, nor does write changes to the system registry. What does it mean? The program doesn’t violate the integrity of the OS, and in case of uninstalling, it will not leave any prints of its presence on your computer. 3rd Dimension “installer” only extracts files to the user-specified folder.
Secondly, the application can be easily stored on removable Drive for use on any other computer as the portable application. It can be convenient when you need to move 3rd Dimension with all of its settings to another PC; just copy 3rd Dimension folder and paste where you need.
To install 3rd Dimension follow these 3 simple steps:
Select the folder to extract application files 3rd Dimension setup screen
Once an extraction process being finished the platform will start automatically with Emulator connection and default workspace.
From this moment you can start trading and analysis as well as workspace modification.
Uninstall
If you need to uninstall the application, just delete the folder with all application files. You may also keep your personal settings (connection information & workspaces) by copying the Settings folder (can be found right in 3rd Dimension folder) before application delete. These Settings folder can be pasted to any other 3rd Dimension folder later. BTW, we are planning to make it possible to store your Settings in 3rd Dimension cloud later.
Updating
When new updates arrive, a user receives an audio signal as well as visual notification in the form of a highlighted platform logo.
Click on this logo, and at the bottom of the start menu, you will see the New Version button, by clicking on which you run the update screen. This screen shows the installed version of the platform.
More details about how to use the 3rd Dimension you can found in our Quick Start Guide.
In case of any questions, please contact us via the preferred contact channel.
Just after the official release of 3rd Dimension trading application, we announce the first trading connection with Poloniex crypto-exchange. Now any trader can try the brand-new trading application using the live account on one of the most popular crypto-exchanges.
When we were thinking about the first connection for our trading application, we decided to start from emerging market, that is fastly growing and attracting a lot of new traders each day. That is why we came to market of digital assets (or Crypto-currency) and started from one of the most popular Exchanges on it – Poloniex.
All needed is on-board
The first release of 3rd Dimension trading application consists of a number of basic functionalities, suitable for Crypto-trading, like “Chart” with a huge set of drawings and indicators, “Order entry” (including limit orders), “Depth of market” and “Watchlist”. Trader can also see and manage its opened orders and positions using functional “Positions” and “Orders” panels. Additionally, trader will like an informational panels “Symbol Info” & “Account Info” that gives the all available information about the account and trading instruments.
Trade on Poloniex using familiar tools via 3rd Dimension trading application
What else can 3rd Dimension propose to Poloniex trader?
The answer is – convenient trading environment. We paid a lot of attention to making the interface of 3rd Dimension as much flexible as possible, giving the trader various leverages for workspace modification. It is possible to set up, group, bind panels and organize them in different trading environments, so-called – Workspaces. Worth to mention, that each separate panel can be customized individually via the personal settings screens. Trader can also set up the default “Setting Layouts” per each panel scope.
Wow. Looking on all of these advantages it is hard to ignore the possibility to try the 3rd Dimension trading application with Poloniex account. In addition, we should mention, that being in an early stage, 3rd Dimension is absolutely free-to-use application so don’t hesitate and go to Download 3rd Dimension right now.
And don’t forget to share your thoughts and impressions with our team via your preferred way. We, the 3rd Dimension Team, are always ready to hear any trader and do the best we can, to make your trading as much profitable as possible.
The rapid development of crypto technologies pushes on the adaptation of not only market participants but also devs of trading applications. 3rd Dimension trading platform continues to expand its list of crypto connections and offers to an increasing number of traders the usage of cool charting and analytical functionality.
We are pleased to introduce the new crypto exchange — Binance — in the arsenal of our trading application’s connections. It means that now you can trade in crypto-currencies, using a wider trading functionality list:
Flexible customization of trading workspaces with an ability to create Binds of panels and save it as Templates.
Time & Sales panel, allowing to filter the trades over a specified size.
Placing orders via the powerful DOM trader panel.
Crypto-balances panel for checking your wallets.
Crypto Order Entry panel, for convenient opening of crypto orders.
Various order types, chart types, drawings, and indicators.
History Player panel, that allows conducting manual backtesting of your trading strategy without any risk.
24/7 market access just like the exchanges.
Binance workspace in 3rd Dimension trading terminal
How to start trading on Binance exchange using 3rd Dimension platform?
Generate an API key on Binance to create a trade connection with 3rd Dimension. Use this API key to log into the platform.
You may watch a short video, demonstrating the basic principles of getting started with Binance in 3rd Dimension application:
Important: Order execution happens on the exchange side. We are merely displaying the information that we receive from the exchange.
Btw, this is not the first connection to crypto-exchange. Earlier, we have connected to the Poloniex crypto exchange, which is also available for trading through 3rd Dimension.
If you follow the development process of our platform, you probably know that since the last update passed less than a month. You’d better get a hold on something because we have prepared a very large release with several connections, valuable analytical features, useful improvements, and fixes.
Volume analysis tools
Cluster chart
As you know, regular chart types (candlestick, bar etc.) are limited to displaying only OHLC data. In this case, the most important data – the trade volume and its distribution at price levels – are hidden. Cluster chart shows the distribution of volume data within each bar, namely:
trading volume
number of trades
the distribution of trades by Ask or Bid prices
delta, the difference between the number of trades by Bid or by Ask
custom filters for trading volume and trades
and even more
As a result, you literally look inside the chart and can clearly assess the intentions of market participants.
Volume profiles
Volume profiles are horizontal histograms that show the distribution of selected volume data for each price level. This allows you to more accurately see the zones of maximum trading interest, and as a consequence, the “true” support/resistance levels. In the 3rd Dimension platform, we have several types of profiles:
Left and Right volume profile can be placed on the left and right side of the chart respectively. For example, you can set the delta data on one profile, and on the other the total volume for the same period of time. You can combine several profiles that are built on different time periods into one combo profile and put it on left or right chart position. We provide you with the full flexibility of the settings for these profiles.
Step profile displays volume profiles with a certain time step.
Custom profile allows you to build a profile on any time range. For instance, you want to see the distribution of the delta on the flat chart or for the impulse bar.
Time statistics (or Bar statistics)
It’s a remarkable functionality that shows extended volume statistics for each individual bar — Total volume, Trades, Buy and Sell volume, Delta, as well as custom filters. For example, you can see how many buy or sell trades have passed in one candle from the total trading volume, assess the delta and the average trade size.
Time histogram
It’s a similar feature to Time statistics that shows volume data as a vertical histogram for each individual bar. But unlike Time statistics, it allows you to visually evaluate the data for each bar, not only by colors but also by the shape of the histogram.
Historical Time & Sales
If you want to see how the trades distributed in a particular bar, then the Historical T & S will be indispensable. By selecting any bar, you will see all the trades from the first second. In this case, you can set up filtering to display data with a certain volume or apply to sort by price, volume, etc.
Price Statistics panel
This panel is an excellent addition for traders who prefer volume analysis. It shows aggregated data on volumes and trades for a specified period at each price level. This functionality is very similar to the Volume Profile, except for the data displays in a tabular form, which can be exported to external files for further analysis.
Kraken, Bitfinex, HitBTC are already available
In this release, we decided to add three crypto exchanges — Kraken, Bitfinex, HitBTC — which (so far) will be available as market data providers. Using their data, you can test your trading systems using History Player. Previously we showed how to operate a History Player panel using the example of FX connections in our article.
Also, you can compare prices for crypto assets on different exchanges, using a simultaneous connection.


