Divergence is when the price of an asset is moving in the opposite direction of a technical indicator, such as an oscillator.
And it warns that the current price trend may be weakening, and could lead to change in the price direction.
What are the best indicators to use for divergence?
In general all oscillator indicators can be used in spotting divergence. We added the most famous indicators that traders use to spot divergence such as RSI, Stochastic, MACD, Momentum, CCI.
How to use Divergence?
Traders use divergence to assess the likelihood of a price reversal for a certain asset. If the asset price is rising and making new highs, ideally the oscillator is reaching new highs as well. If the asset price is making new highs, but the oscillator starts making lower highs, this warns the price uptrend is weakening and a reversal or pullback is possible. On the other hand, if the asset price is creating lower lows and the oscillator is forming higher lows that indicate the down trend is weakening and reversal can happen.
What is unique about Divergence?
Divergence is considered as a leading indicator even though it uses lagging indicators. What makes divergence a unique signal is that it is not obvious to the naked eye which makes it more valuable to the trader because less people will be able to spot such a signal in the market.
Divergences can help us find better and more reliable trade entries. Divergences can not only be used by reversal traders but also trend-following traders can use divergences to time their exits.
Types of Divergence:
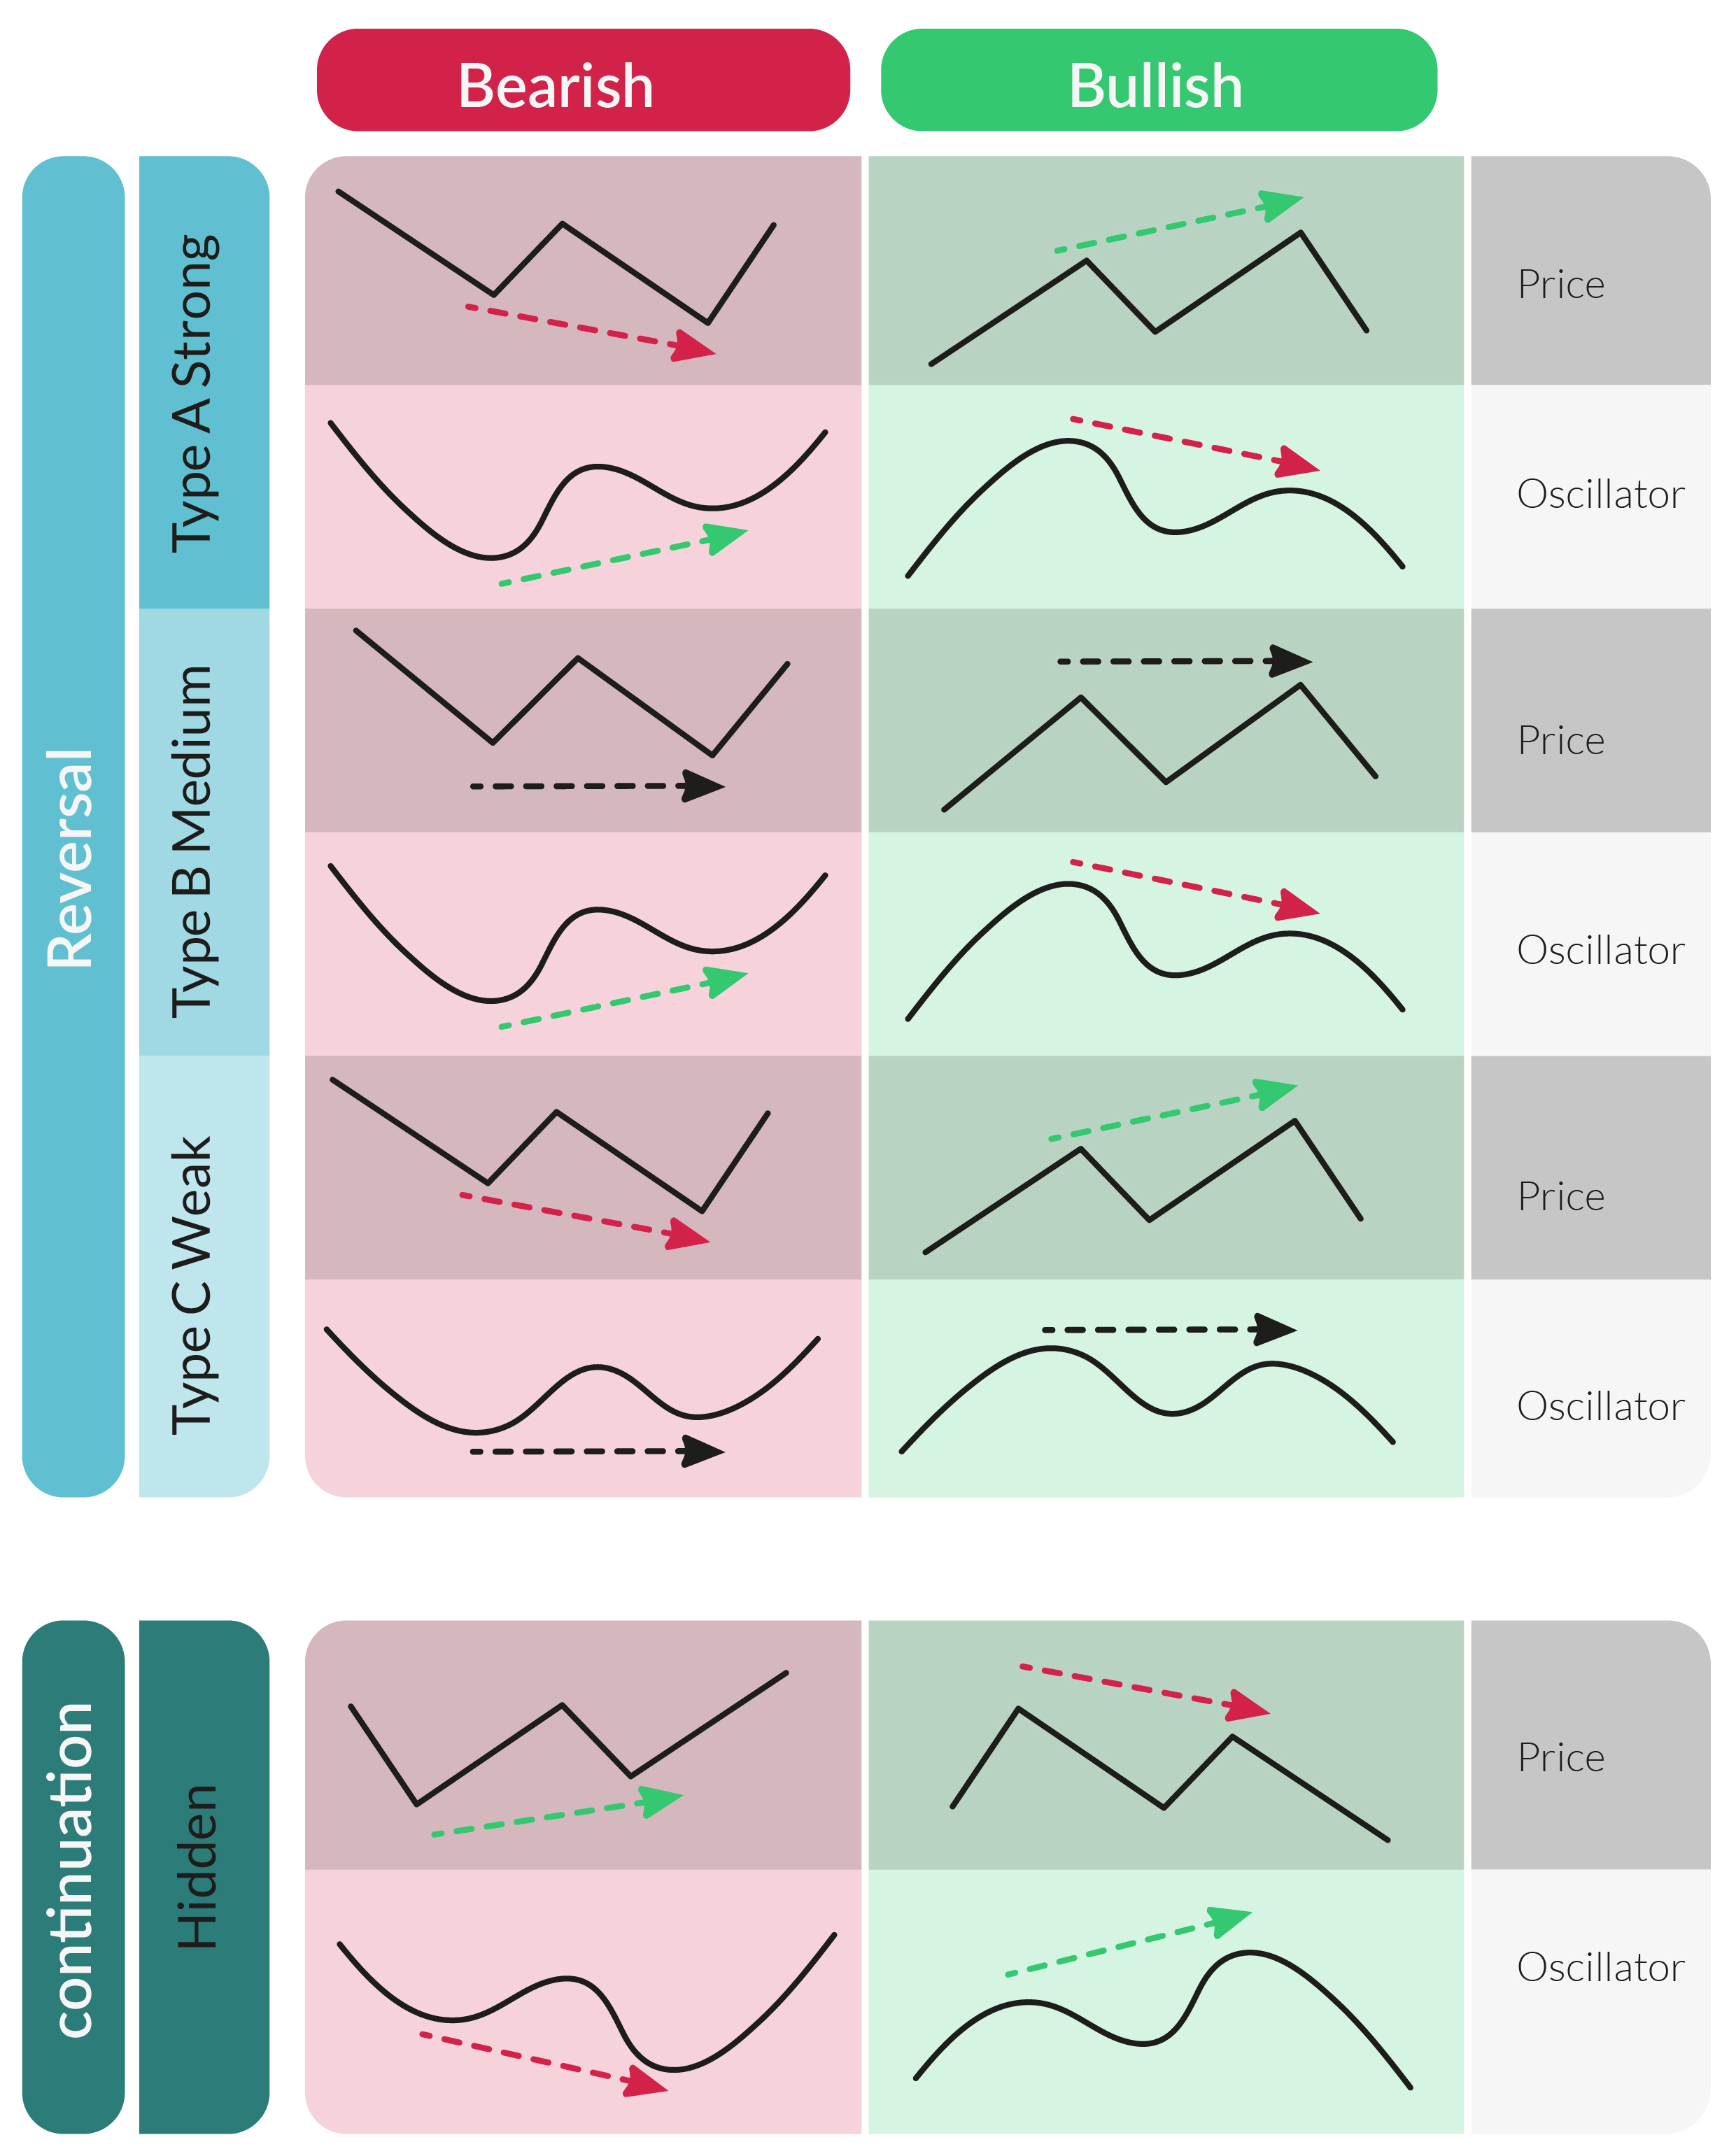
Divergence signals can be categorized based on its direction or its effect direction, and then on its strength.
Regular Divergence (indicate reversals)
Bullish Divergence: Price creates lower low and the indicator creates higher low
Bearish Divergence: Price creates higher high and the indicator creates lower high
Hidden Divergence (indicate continuation)
Bullish Hidden Divergence: Price creates higher low and the indicator creates lower low
Bearish Hidden Divergence: Price creates lower high and the indicator creates higher high
Divergence Classes (strength)
Class A (Strong): both price and indicator divergence lines are steep.
Class B (Medium): Price line is almost straight while indicator line is steep.
Class C (Weak): Indicator line is almost straight while price line is steep.
How to open DivDiv Indicator ?
Open DivDiv indicator from the indicators list on the upper left side of the chart panel.
To open the indicator settings just click on the name of the indicator in the sub-window.
DivDiv Indicator settings ?
Indicator Base: choose the Oscillator that you want to see the Divergence on it from the list of supported indicators.
Divergence Type: choose between two types of Divergence; the Regular (Reversal) type and the Hidden (Continuation) type.
Confirmation Method:
(None) to see all possible Divergences without any type of confirmation,
(Last Peak) to see only the Divergences that the indicator closes above/below latest peak.
(Max Peak) to see only the Divergences that the indicator closes above/below maximum peak.
Divergence Strength: (explained in the Types of Divergence table above )
(Weak) DivDiv Indicator will show all strength levels of Divergence.
(Medium) DivDiv will show all medium and strong levels of Divergence.
(Strong) DivDiv will Show only strong levels of Divergence.
DivScanner Strategy
DivScanner Strategy helps you Scan the Crypto Market for any type of Divergence and send you notification when it finds one.
DivScanner Strategy Settings
Value, Build From: choose the timeframe that you want to search Divergences on.
FromDate: choose the starting date and time that Divergences can be drown from.
Divergence Strength, Confirmation Method, Divergence Type: explained in the DivDiv indicator settings.
Quote: choose the Quote that you want to search for Divergences on all pairs belong to that Quote.
Included Pairs*: write Pairs you want to add to the search to the Quote list. ex: you chose Quote=BTC and you want to add ETH/USDT to all BTC Pairs so you write USDT in the Included Pairs.
Excluded Pairs*:write Pairs you want to Exclude from the Quote list.
Exclusive Pairs*: If you want DivScanner to run on specific numbers of pairs, then you added them in Exclusive Pairs. ex: Exclusive Pairs=BTC/USDT, LINK/BTC, ETH/USDT
*Text is not case sensitive and doesn’t consider spaces between symbols, just add a comma between each symbol.
Min Volume: write the minimum 24h volume to filter the Quote search. ex: Quote= BTC, MinVolume= 100.
Max Volume: write the maximum 24h volume to filter the Quote search. ex: Quote= BTC, MaxVolume= 1000.
You can also choose which indicators you want to scan for Divergences with DivScanner.
We have
recently added a feature that helps traders plan, draft and execute their trade
visually with the help of our commonly used strategy, TPA or Trading Personal
Assistant. By default, traders had to go through the options provided on the
top left corner of the screen.
Before we
explain the particulars of our newly added feature, let’s revisit the concept
of Trading Personal Assistant. What is
Trading Personal Assistant?
TPA –
Trading Personal Assistant is a modern trading bot that helps you automate your
strategy and eliminate all human errors. TPA is a high frequency running
feature in the 3rd Dimension platform that has 4 entry parameters which are
important for every trader, i.e., buy, sell, take profit and stop loss.
By default, the TPA strategy is embedded under Drawings Library option. We can add it permanently on the left corner objects bar just by selecting a small ‘star’ button on the right side of the TPA option. See the below screenshot:
Using the
TPA Button: After selecting the TPA button all we need to do is to go over the
charts and start drawing out respective trade plans on the candles. With this
feature our trade will be up and running within 3 seconds.
Example: The
current price of bitcoin at the time of writing this article is $8082. Let’s
assume that a trader wants to enter a trade at $8100 with a take profit level
at $8800 and stop loss level at $7800. The trader can execute this plan in less
than 3 seconds by – selecting TPA strategy from the left corner objects bar
> Clicking on the entry price on the chart and then adjusting the TP &
SL levels > Mention %age of your account balance for each strategy (default:
0%) > Run
See screenshot:
Next level trading with these 4 TPA
parameters
Before
clicking Run, traders can specify unique trading conditions with the help of
the 4 different strategies coming under TPA strategy, they are:
Power Trades Scanner got predefined settings templates
In order for Power Trades to work properly, it is important to set the parameters that will best suit the specific symbol. Therefore, to make it easy to use the scanner, we have prepared predefined setup templates for 36 instruments traded on the Binance exchange. These settings are the starting point for the use of Power Trades, and every user can set more precise parameters on their own.
So, the screenshot below shows the list of symbols for which we have prepared templates.
Level 2 Indicator
The indicator shows DOM levels with volumes at each price level directly on the chart. This allows you to monitor changes in the DOM without having to open the panel itself. In the settings of the indicator, you can specify the required number of levels, colors, as well as the width of the occupied area on the chart.
Indicator of Separated ATRs
This is a volatility indicator that shows the difference between the two ATR indicators:
the first ATR takes into account only the growing bars
the second ATR only counts falling bars.
Symbol Description on the chart
On the background of the chart, we have added the name of the trading instrument, which you can optionally enable/disable in the general settings of the panel.
One of the great new features, that was developed based on a traders feedback — an abbreviation of crypto prices. This feature allows you to apply a special “shortening” for prices of Crypto-symbols only, resulting in “useless zeros” removal. The algorithm is simple — we just hide all “0” symbols from the left side of price and replace with “..”, for example, 0.0000145 -> ..145. This feature applies globally for all crypto-symbols in application thus changes price values in all panels.
Indicators data in watchlist filters/alerts
Another great advice from our community lead us to develop a possibility to use calculated values of indicators in Watchlist filtering & alerts. Old 3rdDimension traders already know about the possibility to add indicators in Watchlist and see their values in separate columns. Now you can use that values in Table actions functionality (Settings -> Setup actions) to filter rows of call an alert. This simple and yet powerful possibility is available starting from Free version of 3rdDimension .
Omni trend indicator
The Omni Trend indicator (based on the NRTR indicator by Konstantin Kopyrkin) is a trend indicator that uses Average True Range & Moving Average to generate trading signals: buy — when price reaches the previous high & sell — when the price below the previous low.
NRMA indicator
Another interesting indicator that might tell you when go long or short — NRMA indicator. It consists of dots, placed around the price, that suggest bearish (dots are above) or bullish (dots are below) price actions. You can find a lot of information on best practices for this indicator on the internet, but in short: buy when dots are below the price and sell when they are above.