TPO Profile chart and Trading on BitMEX exchange. Check out new features!

TPO Profile chart and Trading on BitMEX exchange. Check out new features!

Here at Quantower, we continue to develop new features, add more connections and of course new panels for your better trading. Therefore, in this release, we are super excited to present a completely new panel — TPO Chart.

Trading on BitMEX exchange

Previously, we’ve connected to BitMEX crypto exchange and it lets you analyze digital currencies and futures in Info mode. This allowed you to use BitMEX data without the API & Secret Keys. 

So today we are happy to announce that we’ve added Trading on BitMEX. Now you are able to enter your personal API Key & Secret Key to trade main cryptocurrencies and their futures.

TPO Profile Chart (a.k.a. Market Profile®)

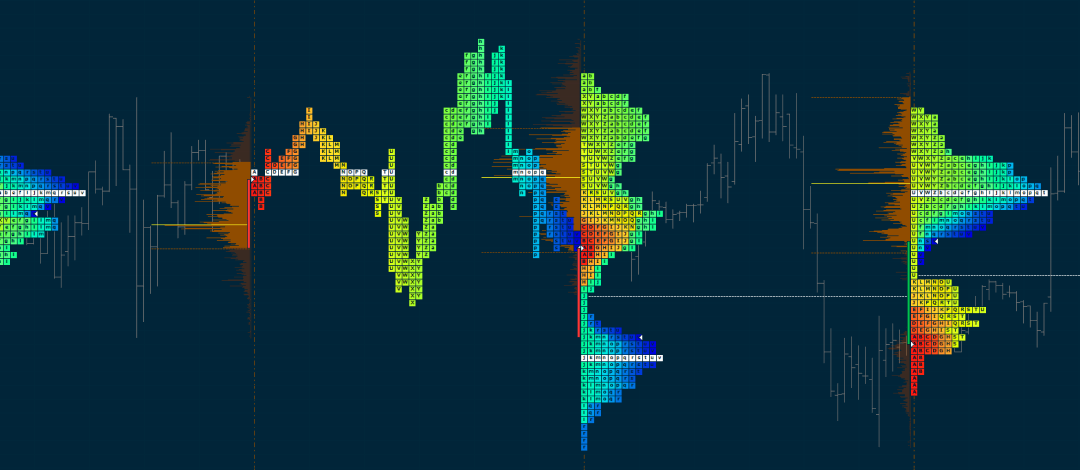
Time Price Opportunity or TPO Chart, shows the price distribution during the specified time, thus forming a profile. This allows you to understand at which levels or ranges the price has spent the most time, as well as to determine the main support and resistance levels.

Let’s take a look at the most interesting points of the TPO chart panel

Building a TPO Profile for any time period

The base element of the TPO chart is letters that are used to build the market profile structure. Each letter initially represents a half-hour period. Quantower offers to specify in the aggregation settings any values on the basis of which the profile will be built. For example, a daily profile of 30-minute bars is considered as a “standard”. But you can set a lower value of “Build From” and the profile will be more granular. Conversely, set the value higher and the shape of the profile will be smoother.

10 coloring modes for profile visualization

Choose any color scheme for better representation and analysis of the TPO profile. Currently, there are 10 different coloring modes available — Single Color, Up/Down Profile, Up/Down Bars, Heatmap, Delta Profile, Delta Price, Delta Bars, Volume Profile, Volume Price, Volume Bars.

Key elements of TPO Profile — POC, Value Area, Singles

In the profile style settings, enable the main elements for precise analysis:

Point of Control (POC) — price level of the greatest market activity or trading volume. At this level, the price spent most time over the profile range.

Value Area — price range in which approximately 68% – 70% of the market activity or trading volume took place.

Singles or single prints of the profile are placed in the middle of a profile structure, not at the upper or lower edge. They occur on impulse movements and are used as support/resistance zones, which the price can test in the near future. The singles line indicates where the singles begin to form (in cases when there are several single prints).


Overlaying the standard chart over the TPO Profile

In the Style settings of TPO Profile enable the “Plot Symbol” option for displaying the standard chart and apply any drawings for technical analysis.


Splitting & Merging the TPO Chart

Use splitting for a detailed analysis of profile formation. There are two splitting modes available in the platform:

  • Split full profile, that separates the profile into each bar or TPO;
  • Divide by bar, that splits the profile in half on the selected bar.

To separate TPO, select the necessary profile and click on the Split button (or use right-click to open the context menu)

Merge is a feature that combines several profiles into one. Right-click on the selected profile to open the context menu and select Merge Left or Merge Right. To return profiles to their original positions, press the Reset button.


Using Volume Analysis tools

TPO profiles are used on their own to find areas of support and resistance, and can also be used in conjunction with volume profiles. For this, we have added Volume Analysis control to the top toolbar of the panel. Here you can select the data type and show/hide the POC & Value Area.


In addition, we have left our standard volume analysis tools, which let you add Time Statistics & Histogram for bar analysis, VWAP, and other tools.

Setting the Session Time 

Set the custom time range for the necessary trading session and the profile will be built within this range. The rest of the time the profile will not take into account


TPO Profile chart panel is available as a separate license as well as for all users with the All-in-One license.

Access to 3d-party extension “Trading Personal Assistant (TPA)”

Every day our trading platform becomes popular not only among individual traders but also among community leaders. As a result, they start to develop their own trading systems and plug-ins.

We are glad to inform you that now on our website on the Pricing page of the separate category there are extensions of our partners. At the moment, the Trading Personal Assistant (TPA) extension is available, which was developed by the 3rd Dimension team. More details about TPA and how it works, please read on their website.

Polygon.io data feed, Binance OCO order and Elliot Wave drawing

Polygon.io data feed, Binance OCO order and Elliot Wave drawing

Connection to Polygon.io data provider

By the numerous requests of our users, we have added Polygon.io that provides Real-time and Historical Market data for Cryptocurrencies, . .

Polygon offers global currency pairs from around the world. Over 1100+ currency pairs streaming in real-time.

Level 1 and Level 2 data from 22 crypto exchanges with coverage of 12+ Crypto Pairs

Connection to Polygon.io data provider

Connection to Polygon.io data provider

OCO Orders for Binance exchange

A month ago, Binance added support for OCO orders (One-Cancels-Other), which are a group of Limit and Stop-Limit order types. When either one of the orders is executed, the other one is automatically canceled. And when canceling either one of the orders, the entire OCO pair is canceled. In this release, we have also added this type of order for our users.

How to create an OCO order on Binance?

For Buy OCO order, the price for limit order < current market price. Also, the trigger stop price > market price.

For Sell OCO order, the price for limit order > current market price. Also, the trigger stop price < market price.

Select OCO from the drop-down list of orders, then specify the price of the Limit order, as well as the price trigger for the stop order and the price of the limit for the stop-limit order. Specify the order volume, then click the Buy (or Sell) button to place the order.

Placing OCO orders on Binance exchange

Placing OCO orders on Binance exchange

New indicator Delta-Rotations

The Delta-Rotations indicator plots in real-time the accumulated aggressive orders of the market participants on each rotational move through the delta. As a result, it allows the detection of shifts between supply and demand through the relation of the height of the bars to their corresponding price and the elapsed time.

Delta Rotations indicator in Quantower platform

Delta Rotations indicator in 3rdDimension platform

In the case of an up move (upward trend), the long elongated structural move will show sustained demand through considerably high bars. On the other hand, pullbacks will show relatively low supply through a shorter rotational move represented by lower selling aggression.

Higher moves with decreasing overall demand (declining delta rotations) show exhaustion through reducing buying pressure and are signs of potential reversals.

The same concepts apply for down moves with dominating supply/selling aggression and decreasing demand/buy aggression.

Custom Tick Size for DOM Trader

In the previous release, we have already added custom Tick Size for Chart and DOM Surface panels. Now it is available for DOM Trader panel as well. For those who missed the previous release, we remind you that this setting “aligns” all levels in DOM to the required tick size.

For example, some data providers and exchanges do not provide the minimum value by which the price of a trading instrument changes. As a result, the price scale uses the wrong value of the price, creating gaps.

Take a look at three screenshots. On the left without Custom Tick Size, on the middle screenshot with this setting. If the tick size is set higher than the minimum or specified by the exchange, the Level2 data will be aggregated like on the right screenshot

Custom Tick Size in DOM Trader panel

Custom Tick Size in DOM Trader panel

Added Elliot triangle Wave, Triangle pattern, Three Drives pattern

Elliot triangle Wave

Elliot Wave is a popular theory in technical analysis, which is based on the cyclical behavior of the price. Using Elliot Wave drawing, you can graphically identify the waves to determine the correction or trend reversal.

Elliot triangle wave drawing in Quantower platform

Elliot triangle wave drawing in 3rdDimension platform

In the drawing settings, you can select the type of wave marker to indicate different types of waves on one chart — Cycle, Primary, Intermediate etc.

Settings of the Elliot Wave drawing

Settings of the Elliot Wave drawing

Triangle pattern

Triangles are a popular technical pattern that analysts frequently use to anticipate potential price reversals. The Triangle Pattern drawing tool allows you to plot four points (A, B, C, D) in order to overlay a triangle onto the candlesticks of a price chart. The idea is to place the points on four alternating highs and lows. That is to say, points A and C would be on consecutive highs (or lows) and B and D would then be on consecutive lows (or highs).

Triangle pattern drawing in Quantower platform

Triangle pattern drawing in 3rdDimension platform

Three Drives pattern

The Three Drives Pattern is a well-known harmonic chart pattern that consists of a series of three higher highs or lower lows, which signals a potential reversal.

In the classical bullish version of this pattern, there are three drives or pushes in the upward direction. After each push, there is a retracement of 0.618 Fibonacci retracements of the previous drive.

The next drive needs to end near the 1.272 Fibonacci extensions for the price action to qualify for the pattern. When the price gets close to the drive 3 point at the 1.272 extension, you would put in an order to sell.

Three Drives Pattern drawing in Quantower platform

Three Drives Pattern drawing in 3rdDimension platform

Your target would be the 0.618 retracement of the entire move from point zero to the top of drive 3. 

Then, of course, the classical bearish pattern is the same thing, but upside down.

Huobi Crypto exchange and New coloring mode for Cluster Chart

Huobi Crypto exchange and New coloring mode for Cluster Chart

Custom coloring mode for Cluster Chart

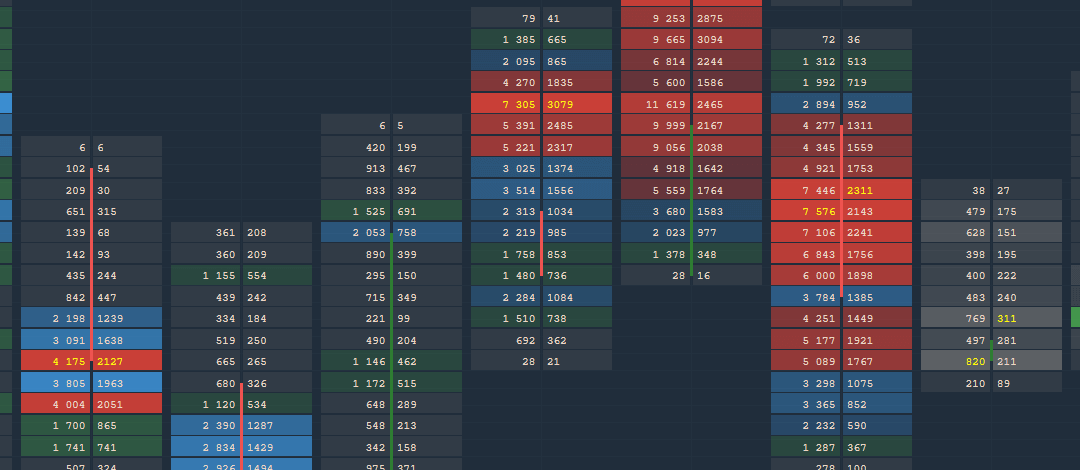
The new color scheme for the cluster chart will allow experienced traders to define more precisely the places and levels with a large volume, number of trades and delta. This is very similar to filtering, which at a given value of the cluster will apply the necessary color. 

As an example, let’s see how it works on ES futures.

Go to the chart settings and select the desired data type on which to build the cluster. Then select Custom coloring in Cluster Visualization. Additional color settings will appear for the three cluster levels. At the first level, we will set 1000 contracts in one cluster, at the second 2000 and at the third 5000. For each level, set green, blue and red colors, respectively.
If you zoom out the chart, then due to the color filtering we can see clusters with large volumes, i.e. zones of high interest. 

Connection to Huobi Global crypto exchange

Added a new trading connection to the popular Huobi Global cryptocurrency exchange. This exchange offers traders 200+ cryptocurrencies and 500+ trading pairs. As for other crypto exchanges, here we also added two connection modes:

Info, allows you to connect without an API Key and make the necessary analysis of the selected cryptocurrency.

Trading mode. Requires unique API & Secret Keys to perform trading operations.

Connection to Huobi Global with Info and Trading modes

Custom Tick Size for Chart and DOM Surface panels

This setting allows you to “align” the chart to the desired tick size. For example, some data providers and exchanges do not provide the minimum value by which the price of a trading instrument changes. As a result, the price scale uses the wrong value of the price, creating gaps. This is especially noticeable on the Order Flow or DOM Surface charts. Using this setting, you can more accurately set the minimum price change and get the correct price display.

Set Custom Tick Size for DOM Surface panel in Quantower

Added the function of minimizing a panel

Any open panel, group or bind can be minimized to the taskbar by clicking Minimize button. This function is quite simple and allows you to more conveniently work with open panels.

Changed the calculation of tick directions for Binance

We improved the mechanism for calculating tick directions, which is involved in volume tools. Earlier, when a new trade executed, if the price did not change, then the volume of this trade we referred to the None category and it did not refer to Buy or Sell. As a result, the total volume of trades marked None reached 50% of the total trading volume.
Now, if a new trade has the same price as the previous trade, it is assigned a category, like the previous trade.

Changed the calculation of tick direction on Binance
New calculation mechanism for tick direction on Binance
3rdDimension Update. Added RTD, info mode for Binance

3rdDimension Update. Added RTD, info mode for Binance

Excel Real-Time Data function

3rdDimension 1.39 supports Real-Time Data (RTD) function for sending data and other market information to Microsoft Excel®. This feature opens up many opportunities for creating custom displays and other ways to better manage your workflow. For instance, you can transmit real-time market data, account info and analyze it on your own. You can use our example Excel file to evaluate RTD possibilities. Also, read our help guide on how to activate RTD and how to work with it in Excel.

RealTimeData function with Quantower and Excel

Binance got an Info Mode. Access to real-time market data without a trading account

The Info Mode lets you connect to the Binance exchange without using the API key, and receive real-time data for all available cryptocurrencies. This mode will be useful for a complete analysis of the market situation, including with the help of Volume Analysis Tools, Order Flow, and various chart types.

Connect to Binance without API Key