Run it before any organized pump and it will buy at the beginning of the pump and sell before the dump. Just set the parameters and you are ready to go.
Disclaimer: Pump Catcher is not a tool to make a pump and dump in any market and does not collaborate with any pump and dump groups on any platform, it simply catches when there is an unusual change in price and allows you to buy and sell very quick on a predefined percentage that you choose.
Before we explain how it can be used let’s explain what is a pump-and-dump scheme?
A pump-and-dump scheme is a type of price manipulation where a group of traders aim to drive an asset’s price up through coordinated buying. Once outside investors notice the surge in price, the insider group starts selling the positions they previously acquired at lower prices, thus making a profit. While it looks very bad there is an opportunity to benefit from this rapid movement in price in a very short period of time.
It is important to mention that pump-and-dump schemes are illegal and considered securities fraud by the United States Seсcurities and Exchange Commission (SEC), but it is still legal or we can say not illegal in cryptocurrency exchanges.
How does the pump happen?
There are several channels on Telegram that organize such a movement, the organizers first buy the coin in silence and then give it to VIP groups couple of minutes before the pump and finally they publish it on public groups so can the crowd FOMO and buy it at scale, then the organizers and VIPs can sell to them at a higher prices.
Pump Catcher will detect such unusual movements in the chart and then buy the coin at the beginning of the pump before the crowd even starts to buy and then sell it hopefully before the organizers sell (it depends on your predefined target ).
What is important about the pump is that we know when it is going to happen. It is enough to run Pump Catcher 5 – 10 minutes before the pump, set the parameters first(explained below) and hit Run.
Strategy Parameter:
There are two types of parameters Basic and Advanced, the former is responsible for how to react against the pump (i.e when the orders should be placed),
While the latter is responsible for detection.
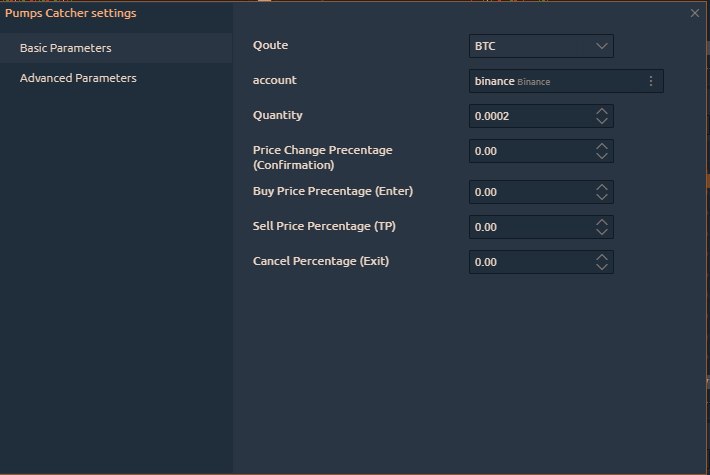
Basic Parameters:
Quote:
The quote asset which one pair of it will be pumped.
Account:
Must be a binance account.
Quantity:
The amount to enter the pump with, taken from quote asset(make sure that you
have BNB balance for the fees).
Price Change Percentage(Confirmation):
The percentage that the price has to increase before entering (placing a buy
order) this is a confirmation that the pair is being pumped.In most cases we
found that 2% price change is good confirmation.
Buy Price Percentage(Enter):
The price that the buy order will be placed at, calculated as a percentage from
time the pump is confirmed.
Sell Price Percentage (TP):
Take profit percentage.
Cancel Percentage(Exit):
The price change in percentage after the buy order placed and before it get
executed (the price jumped above the buy order and the buy order should be
canceled). This parameter ensure that the buy order will not executed in the
dump phase.
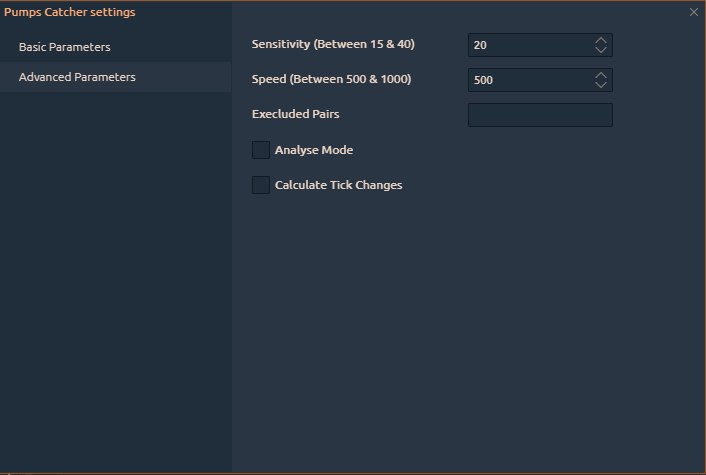
Advanced Parameters:
These parameters are related to the pump group.
Sensitivity (Between 15 & 40):
The more people will enter the pump means the more sensitivity.
Speed (Between 500 & 1000):
The speed that people will react to the pump announcement. Analyse mode:
If this is set, strategy will enter in sandbox mode (no orders will be placed).
Calculate Tick Changes:
If this is set, the symbol’s history will be taken in consideration while
detecting the pump as usual the pumped coin will have a small market cap.
Here at Quantower, we continue to develop new features, add more connections and of course new panels for your better trading. Therefore, in this release, we are super excited to present a completely new panel — TPO Chart.
Trading on BitMEX exchange
Previously, we’ve connected to BitMEX crypto exchange and it lets you analyze digital currencies and futures in Info mode. This allowed you to use BitMEX data without the API & Secret Keys.
So today we are happy to announce that we’ve added Trading on BitMEX. Now you are able to enter your personal API Key & Secret Key to trade main cryptocurrencies and their futures.
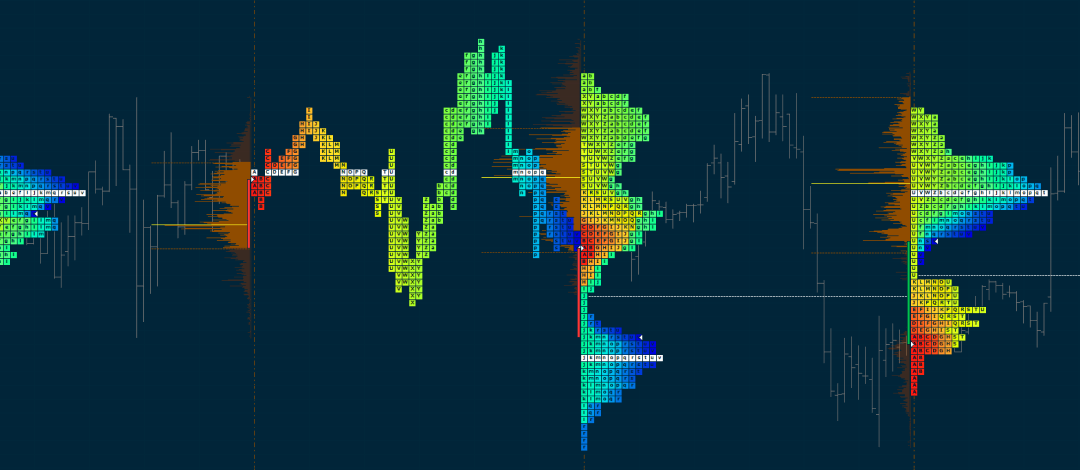
TPO Profile Chart (a.k.a. Market Profile®)
Time Price Opportunity or TPO Chart, shows the price distribution during the specified time, thus forming a profile. This allows you to understand at which levels or ranges the price has spent the most time, as well as to determine the main support and resistance levels.
Let’s take a look at the most interesting points of the TPO chart panel
Building a TPO Profile for any time period
The base element of the TPO chart is letters that are used to build the market profile structure. Each letter initially represents a half-hour period. Quantower offers to specify in the aggregation settings any values on the basis of which the profile will be built. For example, a daily profile of 30-minute bars is considered as a “standard”. But you can set a lower value of “Build From” and the profile will be more granular. Conversely, set the value higher and the shape of the profile will be smoother.
10 coloring modes for profile visualization
Choose any color scheme for better representation and analysis of the TPO profile. Currently, there are 10 different coloring modes available — Single Color, Up/Down Profile, Up/Down Bars, Heatmap, Delta Profile, Delta Price, Delta Bars, Volume Profile, Volume Price, Volume Bars.
Key elements of TPO Profile — POC, Value Area, Singles
In the profile style settings, enable the main elements for precise analysis: Point of Control (POC) — price level of the greatest market activity or trading volume. At this level, the price spent most time over the profile range. Value Area — price range in which approximately 68% – 70% of the market activity or trading volume took place. Singles or single prints of the profile are placed in the middle of a profile structure, not at the upper or lower edge. They occur on impulse movements and are used as support/resistance zones, which the price can test in the near future. The singles line indicates where the singles begin to form (in cases when there are several single prints).
Overlaying the standard chart over the TPO Profile
In the Style settings of TPO Profile enable the “Plot Symbol” option for displaying the standard chart and apply any drawings for technical analysis.
Splitting & Merging the TPO Chart
Use splitting for a detailed analysis of profile formation. There are two splitting modes available in the platform:
Split full profile, that separates the profile into each bar or TPO;
Divide by bar, that splits the profile in half on the selected bar.
To separate TPO, select the necessary profile and click on the Split button (or use right-click to open the context menu)
Merge is a feature that combines several profiles into one. Right-click on the selected profile to open the context menu and select Merge Left or Merge Right. To return profiles to their original positions, press the Reset button.
Using Volume Analysis tools
TPO profiles are used on their own to find areas of support and resistance, and can also be used in conjunction with volume profiles. For this, we have added Volume Analysis control to the top toolbar of the panel. Here you can select the data type and show/hide the POC & Value Area.
In addition, we have left our standard volume analysis tools, which let you add Time Statistics & Histogram for bar analysis, VWAP, and other tools.
Setting the Session Time
Set the custom time range for the necessary trading session and the profile will be built within this range. The rest of the time the profile will not take into account
TPO Profile chart panel is available as a separate license as well as for all users with the All-in-One license.
Access to 3d-party extension “Trading Personal Assistant (TPA)”
Every day our trading platform becomes popular not only among individual traders but also among community leaders. As a result, they start to develop their own trading systems and plug-ins.
We are glad to inform you that now on our website on the Pricing page of the separate category there are extensions of our partners. At the moment, the Trading Personal Assistant (TPA) extension is available, which was developed by the 3rd Dimension team. More details about TPA and how it works, please read on their website.
Trading Personal
Assistant – A trader’s best friend
Basic & Advance
parameters walkthrough
A brief explanation of
each combination of strategies
There have been many
instances where we form a strategy in our head, backtest it to see the success
rate and after all the conditions are satisfied we implement it as our trading
style. But even after finding a ‘perfect strategy’ there are a lot of hiccups
in executing it step by step because of several following reasons:
Emotions (One of the biggest reason)
Lack of time to spot the opportunity in the market
Low liquidity in our trading basket – Seed capital gets
locked once we ‘limit order’ some trades
……..and the list goes on. Talking about the biggest money/opportunity
killer i.e., Emotions, we often get taken for a ride by the market makers and
unnecessary FUD (fear, uncertainty & doubt) that challenges our technical
plan of execution and finally tweaks our mindset against the trade.
In 3rd
Dimension, it is possible to remove all the above errors that come into the way
of implementing & executing a strategy. Not only that, but the platform
also helps you to determine certain ‘conditions’ that decreases your chances by
almost 90% from being a victim of ‘Stop hunts’ by Market makers, makes your
trades more profitable and also open gates to several trade opportunities by
not locking your capital by limit orders.
These features are made
possible by our flagship tool – TPA (Trading Personal Assistant).
Meet Trading Personal Assistant – A trader’s
best friend
TPA – Trading Personal Assistant is a modern trading bot that helps you
automate your strategy and eliminate all human errors. TPA is a high frequency
running feature in the 3rd Dimension platform that has 4 entry
parameters which are important for every trader, i.e., buy, sell, take profit
and stop loss.
Taking a deep dive into each parameter
TPA provides these 4
parameters under two heads:
Basic
Advance
Basic
The basic parameters
help the trader define their strategy by providing them with 3 following options:
Resistance breakout
Buy Support
TPnSL
Market Exit
Defining Buy Support & Resistance Breakout
strategies:
Buy support iterates a condition where the trade gets executed only when
the price reaches the level defined by the trader.
Resistance breakout iterates a condition where the trade gets
executed only when the price breaks a certain level defined by the trader.
Both of these
strategies are very useful when more conditions and variables are defined in
Advanced Parameters.
Enhancing Resistance Breakout strategy in Advanced
Parameters:
One of the major key
parameter provided by TPA is defining the Buy
event. Buy event provides the trader with the following conditions:
OnPriceHit
OnPriceHit under Resistance Breakout strategy is a parameter where the entry of the trade happens when
the price hits the entry-level defined by the trader. It is a simple
resistance breakout strategy.
OnBarClose
In this condition, the
entry of the trade happens only when the bar
breaks and closes on or above the entry-level defined by the trader. In T.A, a breakout is said to be valid
only when the concerned timeframe bar closes above a certain level. There are
many times when the price breaks above a certain technical level and retraces
immediately back below the level, trapping most of the traders into the trade.
This phenomenon is called Fake Breakout or fake-out.
OnBarClose eliminates the risk of getting trapped into the fake-outs
and helps the traders to only enter valid resistance breakout trades.
OnBarRetest
This parameter lets the
traders enter the trade only when the following condition is satisfied
Price breaks the level defined by the trader
Bar closes above the said level
The bar goes back and retests the said level
According to T.A when
the price breaks a resistance level, the said level now becomes the support. In
the Resistance Breakout strategy,
most of the traders feel comfortable to only enter the trade when the price
converts a resistance into support and goes down to test the support resulting
in the continuation of the trend.
Never miss opportunities by locking capital in ‘limit
trades’
LocalLimit condition in the Buy
Order Type parameter stands for facilitating trade in the local order book
of 3rd dimension only and not in the actual order book of the
exchange until all the other conditions are satisfied. The trades are only
posted and executed in the actual market order book when the conditions defined
by the trader happens.
While using the Limit condition in the Buy Order Type parameter, the trader
can only post 10 trades in the system (if the capital allotted per trade is 10%
of the portfolio), whereas if LocalLimit
condition is used then the system allows the trader to post more than 10
trades (even if the capital allotted per trade is 10% of the portfolio). So the
merit of using the LocalLimit condition
is it doesn’t reserve your capital and only executes the trade when the
conditions are satisfied.
Manage risk with Sell (Exit) Parameters
Another solution
provided by TPA for risk management is SELL
(EXIT) PARAMETERS. This parameter helps the traders to minimize their risk
by defining the exit condition of the trade.
As mentioned above, a
breakout becomes fake-out when the price retraces below the level which it
originally broke out from. This is the time when the SELL (EXIT) PARAMETERS come into play, it automatically places a
sell limit order at the entry price so that the trades exit the trade with zero
loss.
Let’s explain this with
a hypothetical example:
Without Sell (exit)
parameter: A trader goes long (buy) on BTC/USDT at $7900 (resistance breakout),
he puts the take profit level at $8500 and stop loss level at $7700. Now, the
trade is running until any one of the two conditions are satisfied, i.e. either
the take profit level gets hit, the trader books a profit of $600 or the stop loss level gets hit, the trader
books a loss of $200.
With Sell (exit)
parameter: A trader goes long (buy) on BTC/USDT at $7900 (resistance breakout),
he puts the take profit level at $8500, sell (exit) parameter at $7900 and
stop-loss at $7700. In this case, the trade is running until any one of the three
conditions are satisfied, i.e. either the take profit level gets hit, the
trader books a profit of $600 or the resistance breakout becomes invalid as the
price retraces below the entry price(candle closing below) and the trader gets
out of the trade with ZERO LOSS
Increase profitability with TP Event parameters
Traders must be
familiar with certain events in the market where the price not only hits the
take profit level defined by them but it also goes beyond that level. In these
times, the traders either find themselves in a situation where they feel more
profit could be taken out of the market and sometimes most traders often
re-enter the trade in expectation of a continuation of the trend. This is a
human error as a technically calculated trade is now dominated by the Emotions
of the trader. As you know the answer, the trade always goes against the trader
if emotions are involved.
TPA helps the trader to
not only wipe the emotions out of the trade but also increase profitability in
case the price goes beyond the tp level.
There two options in
the ‘TP Event’ parameter, OnPriceHit
& OnBarClose. OnPriceHit is just
like any traditional take profit parameter where the profit is automatically
booked when the price hits the tp level. Whereas, OnBarClose is a parameter where the profit is automatically booked
when the defined bar not only hits the tp level but also closes above it.
No more Stop Hunts by Market Makers
The very common area to set a stop loss is either a
support zone or a resistance zone, depending upon the direction of the trade. In
the times of extreme volatility, the price often hits the sl first before
continuing in the direction of the trade. In this event, the trader loses the
opportunity to execute a successful trade and even incurs a loss as the sl
level is hit.
To eliminate this issue of stop hunt, traders can
select the option of OnBarClose in
the SL Event parameter. OnBarClose is a condition where the
loss only gets booked if the bar closes on or beyond the stop loss level
defined the trader.
Bonus money management features in the Order Parameter section:
Base quantity
(applied): Base quantity is a simple and standard condition where one can
specify the total amount of the selected asset they want to allot for the
trade.
Quote
Percentage: This condition allows the trader to allot
a certain percentage of his/her capital per trade. Say, a trader has $6789 in
the trading account and he/wants to put 18% of his capital into a trade then he
can simply put 18% as the Quote
Percentage parameter and the assistant will automatically put the
calculated amount of capital in the Base quantity (applied) parameter.
Whatever the type of trading instrument — stocks, futures, currency, cryptocurrency — the entire trading process is focused on an attempt to predict the future price of the asset. As a result of this competition, traders develop new ways of price analysis based on historical and fundamental data. But is it possible to have a trading advantage in the market and how to achieve it?
Before answering these questions, let’s take a look at the market from the point of view of the order flow, which constantly influences the price movement of the asset. As new information comes to the market, participants (including algorithms) adjust open positions, place new or cancel existing orders based on expectations of the future price movement.
Moreover, the market can be irrational and act against objective and fundamental reasons. This is because the price is a reflection of the total mood of market participants, which can quickly change. Therefore, it is important to understand at which point in time the market situation will change, and under which conditions the advantage will be in our favor.
But first, let’s consider the concept of Order Flow and how to use it together with the Power Trades scanner.
What is Order Flow and why it’s important?
Order Flow describes the ongoing price movement based on the orders that are flowing into the market in regards to the available momentary liquidity at each price level. It is a continuous process of placing, modifying, canceling and executing orders by market participants. Each of these actions affects not only the current price but also the expectations of traders regarding the future price of the asset.
For example, if order with a large size appears in the Depth of Market, the price is likely to reach this level and the order will be executed. This happens because the price tends to move towards high liquidity levels, i.e. to the zones of limit orders accumulation to meet consent between buyers and sellers. The market is always attempting to reach for a balance market distribution to facilitate the trades between buyers and sellers.
How orders are executed? Basic terms and explanation
Prices move only because of market aggressivity (market orders). Without aggression, the market would stop at the current best bid/ask price and never leave that state. It is important to understand that in the market auctioning process for every buyer there is a seller otherwise the auction cannot take place! Thereby it is nonsense to state that is at any given time there are more of either. For a market to move there has to be an imbalance overwhelmed by either side willing to show more aggression.
How is the order executed?
Based on the trading rules, there are two main types of orders in the market:
Limit orders, which are liquidity or fuel for market movements represent resting order pending to be filled (passive orders). It is important to understand that liquidity exists only at a better price than the current one. Therefore, sell orders are always higher than the current price and are called Ask or Offer, and buy orders are located below the current price and called Bid.
Market orders, represent market aggression and are the market constituents that drive the price either up and down.
Zones showing a substantial size of resting orders (limit orders) create barrier levels of liquidity (support and resistance levels). Those barriers will stop any further movement with a lack of aggression. Indeed for the price to move through those levels, liquidity has to be filled first though market aggression! This is the reason why prices tend to move sideways around those levels until either side overwhelms.
For a price to move higher buyers need to be aggressive and start lifting the offer. This trade is executed on the Ask/Offer Side. This price will continue moving higher as long as there are MORE aggressive buyers then passive sellers
For a price to move lower the sellers need to be aggressive and start hitting the bid. This trade is executed on the Bid Side. The price will continue to move lower as long as there are MORE aggressive sellers then passive buyers.
Market executions come in pairs:
An aggressive buyer gets filled on a passive seller,
An aggressive seller gets filled on a passive buyer.
Let’s consider a simple example of how orders are matched and executed. For simplicity reason let us start with an empty Depth of market with no liquidity on both sides.
For example, there are two buyers on the market who placed limit orders for buying on 37 and 84 contracts with the price at 2386,75 and 2386,5 in accordance.
A few minutes later two sellers step into the market and also placed limit orders for selling for 53 and 12 contracts with the price 2387 and 2387,25 in accordance.
As a result, we see offers on every side, but none of these orders cannot be matched between each other, because sellers’ and buyers’ wishes do not coincide. Now imagine the trader, who agrees to the sellers’ offers and is ready to buy 45 contracts at a market price. This is the aggressive buyer, who doesn’t care for the price but cares about the fact of orders execution.
The best price offer by the seller is 2387, which is equal to the price of the last trade. After the execution of 45 contracts, the price has not changed, because there are 8 more contracts for this price (53-45=8).
After a while, another trader has decided to sell 22 contracts at a market price. At the current moment, the best price for selling is 2386,75, with 37 limit orders on it. As a result of this trade, the price has moved for one tick from 2387 to 2386,75, and 15 limit orders still remain (37-22=15) and stop the price of the further decrease. It is necessary for a market order to execute the remaining 15 contracts, for the price to decrease.
The Map of Order Flow
Candlesticks only allow you to follow the historical price change without in-depth knowledge about the actual liquidity presented at those different moments. Markets are in constant auctioning for multiple reasons (HFTs, Hedging, Spreading, Swinging, etc.) so that the liquidity is constantly changing. But tracking changes in order sizes at each price becomes difficult when the number of levels in Depth of Market reaches several hundred, as in the crypto market.
Therefore, the DOM Surface panel solves this problem, as it shows changes in liquidity at each price level — adding new orders, changing or canceling. The brighter the level, the more orders are placed at a specific price level.
What is Power Trades Scanner?
Power Trades shows the zones with the execution of a large number of orders in a very short time. These zones are the result of a short-term “abnormal event” that is likely to affect the price change. Such an anomaly includes a short-term imbalance between aggressive buyers and aggressive sellers, which leads to price changes.
How does Power Trades find zones?
First, let’s take a look at the screenshot of the 1-second chart of the E-mini S&P 500 futures. The chart shows the zone with a volume of 940 contracts, which were executed within1 second. Using Historical Time & Sales feature we can see the history of all trades that were executed within that period.
Considering that in the scanner settings we set a total volume filter higher than 800 contracts within a time interval of 1sec, the scanner found the zone and showed it on the chart. The scanner also showed the price range of the zone formation.
The appearance of the zone only indicates a significant trade interest, so the information about the volume will not be sufficient. To understand the imbalance that led to the appearance of the zone, it is necessary to take into account the values of the delta and basis ratio also.
What does the Delta value show?
Delta is a quick way to determine who is in control of the market through aggressive orders, buyers or sellers. Delta is the difference between the volume traded on the offer minus the volume traded on the bid in a particular bar or zone. Each bar (zone) will have a delta number. Delta will either positive or negative and on rare occasions, it can even be zero.
The positive value of the delta indicates the activity of aggressive buyers at the current market price. And since market buy orders are executed only on the ask/offer side through lifting (sell limit orders), a positive delta may indicate an attempt of a large participant to gain a short position through limit orders (passive filling).
The same applies to the negative delta, which indicates the activity of aggressive sellers or an attempt by a large participant to gain a long position through limit orders (passive filling).
What does the Basis ratio mean?
Basis Ratio shows the ratio of the volume in the zone to the total volume for the specified time. In our example above, the zone had the value Basis Ratio = 5.67%. It means that the volume of 940 lots occupies only 5% of the total volume for the last 5 minutes.
On the screenshot below the zone with the volume of 2246 lots, and the total volume for the last 5 minutes was 11040. Thus, the found zone has the Basis Ratio of 20.34%.
Whether this is a lot or not depends on a particular trading instrument. For ES futures, base ratio values above 10% are considered high.
Order Book Imbalance and DOM levels
After activating Power Trades, a table divided into two parts will appear on the right side of the chart. The upper part contains the results of the zones that the scanner found, and the bottom part shows two histograms in real-time: DOM Levels (left) and Imbalance (right).
DOM is a well-known functionality that shows the current order book and its dynamics in real-time. The number of limit orders for ask and bid side is shown as a histogram with corresponding values at each price level.
The Order Book Imbalance is a ratio between the volume of limit order at bid and ask side. It measures whether the limit order book is buy or sell heavy. The more the imbalance exceeds one side, the higher the probability of price movement towards the imbalance. In fact, it is a good predictor of price direction.
An imbalance is calculated for each price level, starting with the best bid and best offer. With an imbalance value of 50%, the market is in equilibrium, and traders agree with the current price. As soon as the supply/demand ratio changes and new orders are placed, the imbalance indicator automatically recalculates its values.
For example, on the ESZ19 futures at a price of 2975.75, the imbalance value at the 10th level is 61.8%, which indicates that the volume of sell limit orders is 12% higher than the buy limit orders. It is also necessary to pay attention to the levels with the maximum volume because they are like a “magnet” for the price. At these levels, you can place your sell orders or fix the profit.
The screenshot below shows that the price has reached the level of 2977, where previously there were 637 contracts. This does not mean that the entire volume at this level was executed. But in fact, the price tested this level, while Imbalance Level2 slightly decreased.
Additionally, you should look at the Cluster chart, which will show how many Buy and Sell orders were executed at each price.
How to find better trades with the Power Trades?
The settings for Power Trades should be set individually for each instrument. This is due to the difference in liquidity and trading volume, which takes place during the day.
For example, for ES futures, it is better to use two different settings for the European and American trading sessions. The screenshot below shows the difference in trading volumes for the two sessions. Therefore, settings that give good signals for one session will give many false signals for another session.
Power Trades signals should be considered in the context of the chart and other analysis tools — support and resistance levels, Price Action, VWAP, Volume Profiles.
Example #1 on ES futures
Why did we buy at this level?
Local support zone
Two Power Trades signals with negative delta. Settings for the filter of the scanner are 2000 lots and a delta of 60%.
There is a zone above that has not been tested. Such zones are always tested.
Example #2 on ES futures
At the moment of publication of important fundamental news, the market volatility increases. At this point, large traders cancel their limit orders and waiting for the results of the news. In addition, traders who already have opened positions set a stop-loss or take-profit orders. At the moment of the news release, these orders are executed and as a result, Power Trades signal will appear.
As you can see in the screenshot above when the news came out, the price fell significantly, and as a result, there were several Power Trades zones.
The best entry point will be from the strong support levels with the first target to the nearest zones.
By the numerous requests of our users, we have added Polygon.io that provides Real-time and Historical Market data for Cryptocurrencies, . .
Polygon offers global currency pairs from around the world. Over 1100+ currency pairs streaming in real-time.
Level 1 and Level 2 data from 22 crypto exchanges with coverage of 12+ Crypto Pairs
Connection to Polygon.io data provider
OCO Orders for Binance exchange
A month ago, Binance added support for OCO orders (One-Cancels-Other), which are a group of Limit and Stop-Limit order types. When either one of the orders is executed, the other one is automatically canceled. And when canceling either one of the orders, the entire OCO pair is canceled. In this release, we have also added this type of order for our users.
How to create an OCO order on Binance?
For Buy OCO order, the price for limit order < current market price. Also, the trigger stop price > market price.
For Sell OCO order, the price for limit order > current market price. Also, the trigger stop price < market price.
Select OCO from the drop-down list of orders, then specify the price of the Limit order, as well as the price trigger for the stop order and the price of the limit for the stop-limit order. Specify the order volume, then click the Buy (or Sell) button to place the order.
Placing OCO orders on Binance exchange
New indicator Delta-Rotations
The Delta-Rotations indicator plots in real-time the accumulated aggressive orders of the market participants on each rotational move through the delta. As a result, it allows the detection of shifts between supply and demand through the relation of the height of the bars to their corresponding price and the elapsed time.
Delta Rotations indicator in 3rdDimension platform
In the case of an up move (upward trend), the long elongated structural move will show sustained demand through considerably high bars. On the other hand, pullbacks will show relatively low supply through a shorter rotational move represented by lower selling aggression.
Higher moves with decreasing overall demand (declining delta rotations) show exhaustion through reducing buying pressure and are signs of potential reversals.
The same concepts apply for down moves with dominating supply/selling aggression and decreasing demand/buy aggression.
Custom Tick Size for DOM Trader
In the previous release, we have already added custom Tick Size for Chart and DOM Surface panels. Now it is available for DOM Trader panel as well. For those who missed the previous release, we remind you that this setting “aligns” all levels in DOM to the required tick size.
For example, some data providers and exchanges do not provide the minimum value by which the price of a trading instrument changes. As a result, the price scale uses the wrong value of the price, creating gaps.
Take a look at three screenshots. On the left without Custom Tick Size, on the middle screenshot with this setting. If the tick size is set higher than the minimum or specified by the exchange, the Level2 data will be aggregated like on the right screenshot
Custom Tick Size in DOM Trader panel
Added Elliot triangle Wave, Triangle pattern, Three Drives pattern
Elliot triangle Wave
Elliot Wave is a popular theory in technical analysis, which is based on the cyclical behavior of the price. Using Elliot Wave drawing, you can graphically identify the waves to determine the correction or trend reversal.
Elliot triangle wave drawing in 3rdDimension platform
In the drawing settings, you can select the type of wave marker to indicate different types of waves on one chart — Cycle, Primary, Intermediate etc.
Settings of the Elliot Wave drawing
Triangle pattern
Triangles are a popular technical pattern that analysts frequently use to anticipate potential price reversals. The Triangle Pattern drawing tool allows you to plot four points (A, B, C, D) in order to overlay a triangle onto the candlesticks of a price chart. The idea is to place the points on four alternating highs and lows. That is to say, points A and C would be on consecutive highs (or lows) and B and D would then be on consecutive lows (or highs).
Triangle pattern drawing in 3rdDimension platform
Three Drives pattern
The Three Drives Pattern is a well-known harmonic chart pattern that consists of a series of three higher highs or lower lows, which signals a potential reversal.
In the classical bullish version of this pattern, there are three drives or pushes in the upward direction. After each push, there is a retracement of 0.618 Fibonacci retracements of the previous drive.
The next drive needs to end near the 1.272 Fibonacci extensions for the price action to qualify for the pattern. When the price gets close to the drive 3 point at the 1.272 extension, you would put in an order to sell.
Three Drives Pattern drawing in 3rdDimension platform
Your target would be the 0.618 retracement of the entire move from point zero to the top of drive 3.
Then, of course, the classical bearish pattern is the same thing, but upside down.