What is Divergence?
Divergence is when the price of an asset is moving in the opposite direction of a technical indicator, such as an oscillator.
And it warns that the current price trend may be weakening, and could lead to change in the price direction.

What are the best indicators to use for divergence?
In general all oscillator indicators can be used in spotting divergence. We added the most famous indicators that traders use to spot divergence such as RSI, Stochastic, MACD, Momentum, CCI.
How to use Divergence?
Traders use divergence to assess the likelihood of a price reversal for a certain asset. If the asset price is rising and making new highs, ideally the oscillator is reaching new highs as well. If the asset price is making new highs, but the oscillator starts making lower highs, this warns the price uptrend is weakening and a reversal or pullback is possible. On the other hand, if the asset price is creating lower lows and the oscillator is forming higher lows that indicate the down trend is weakening and reversal can happen.
What is unique about Divergence?
Divergence is considered as a leading indicator even though it uses lagging indicators. What makes divergence a unique signal is that it is not obvious to the naked eye which makes it more valuable to the trader because less people will be able to spot such a signal in the market.
Divergences can help us find better and more reliable trade entries. Divergences can not only be used by reversal traders but also trend-following traders can use divergences to time their exits.
Types of Divergence:
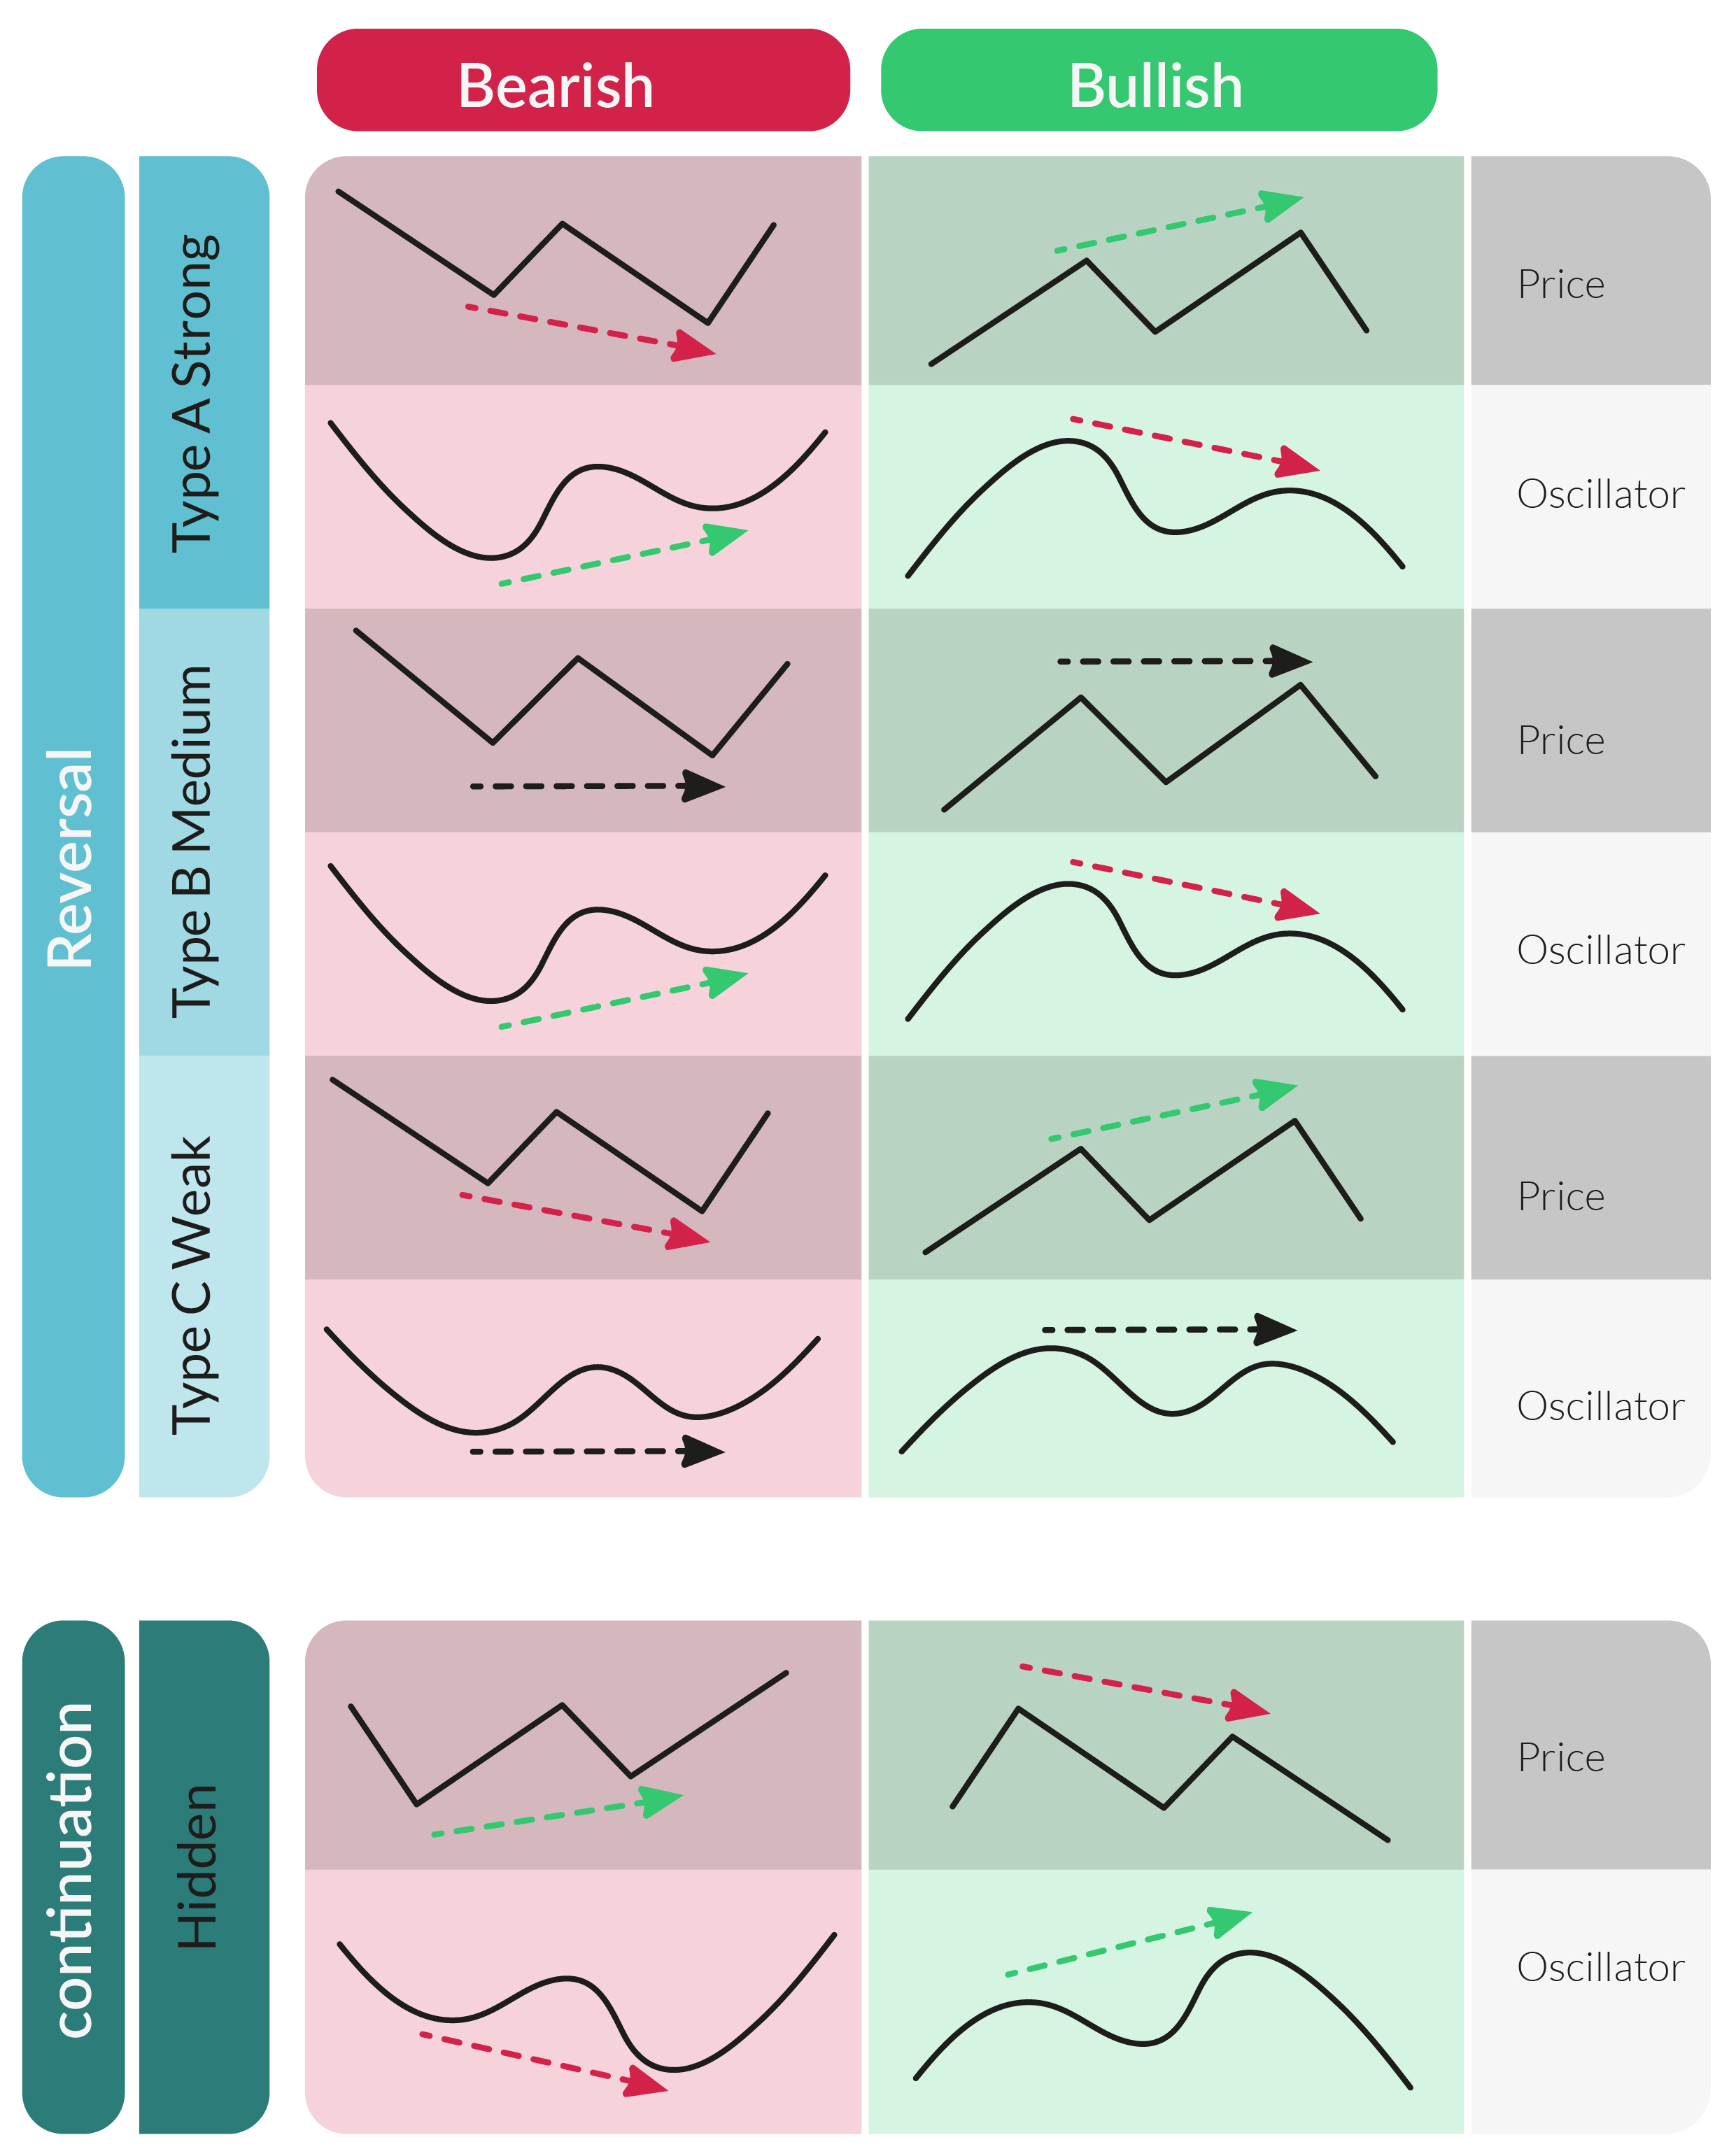
Divergence signals can be categorized based on its direction or its effect direction, and then on its strength.
Regular Divergence (indicate reversals)
Bullish Divergence: Price creates lower low and the indicator creates higher low
Bearish Divergence: Price creates higher high and the indicator creates lower high
Hidden Divergence (indicate continuation)
Bullish Hidden Divergence: Price creates higher low and the indicator creates lower low
Bearish Hidden Divergence: Price creates lower high and the indicator creates higher high
Divergence Classes (strength)
Class A (Strong): both price and indicator divergence lines are steep.
Class B (Medium): Price line is almost straight while indicator line is steep.
Class C (Weak): Indicator line is almost straight while price line is steep.
How to open DivDiv Indicator ?
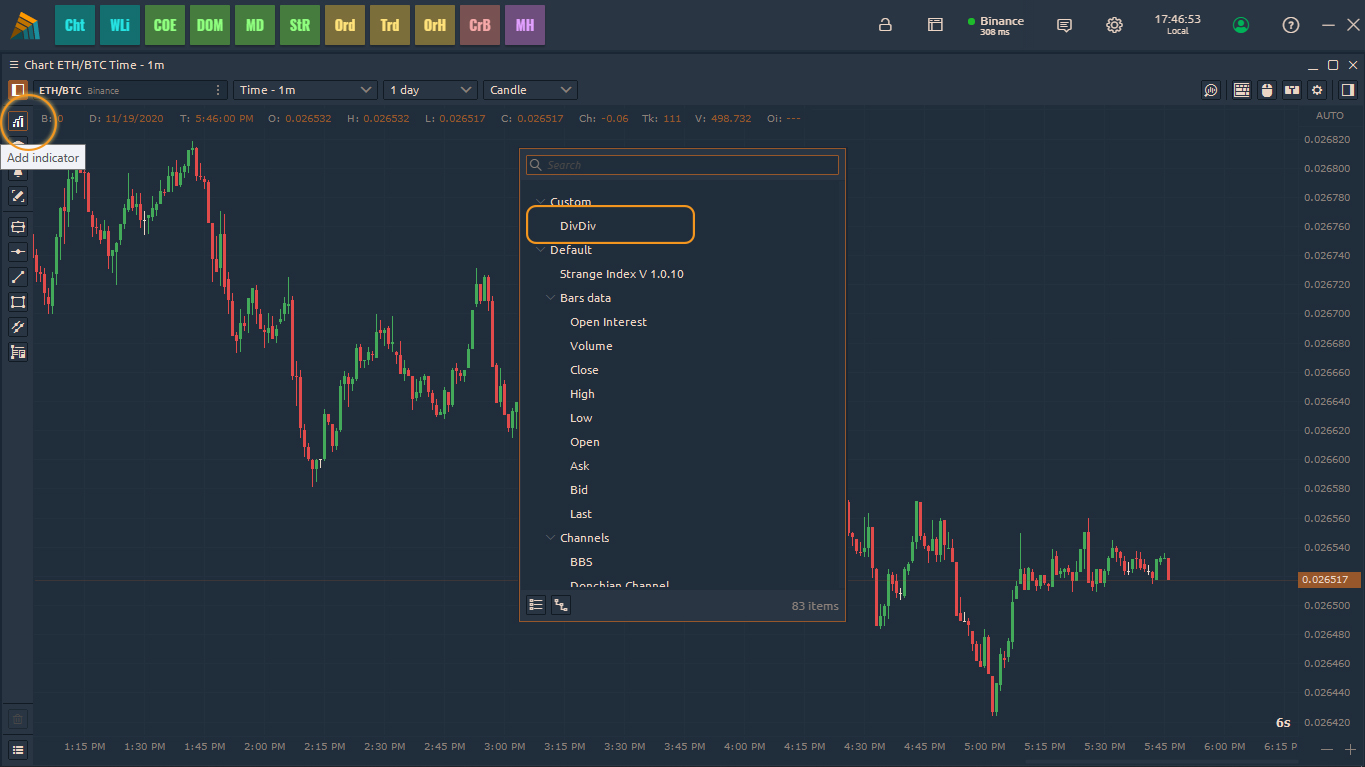
Open DivDiv indicator from the indicators list on the upper left side of the chart panel.
To open the indicator settings just click on the name of the indicator in the sub-window.
DivDiv Indicator settings ?
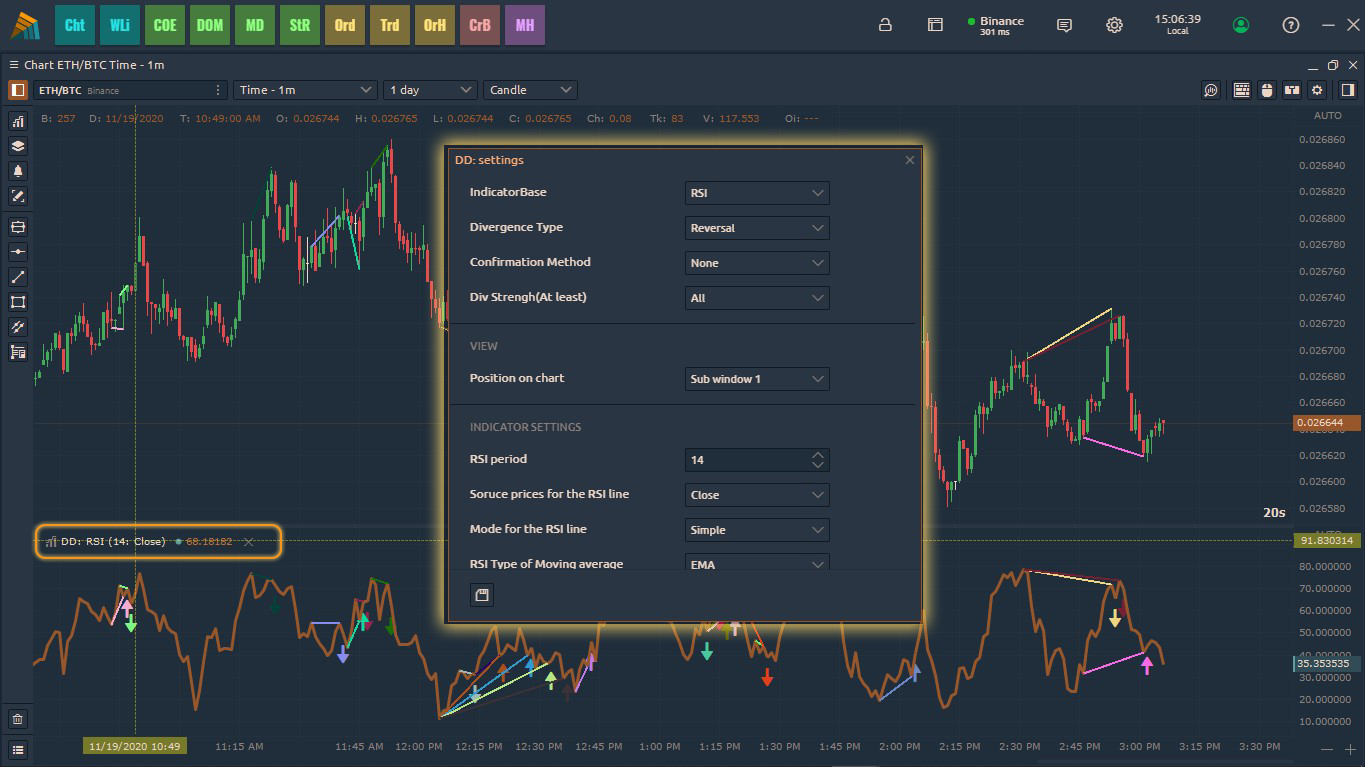
Indicator Base: choose the Oscillator that you want to see the Divergence on it from the list of supported indicators.
Divergence Type: choose between two types of Divergence; the Regular (Reversal) type and the Hidden (Continuation) type.
Confirmation Method:
(None) to see all possible Divergences without any type of confirmation,
(Last Peak) to see only the Divergences that the indicator closes above/below latest peak.
(Max Peak) to see only the Divergences that the indicator closes above/below maximum peak.
Divergence Strength: (explained in the Types of Divergence table above )
(Weak) DivDiv Indicator will show all strength levels of Divergence.
(Medium) DivDiv will show all medium and strong levels of Divergence.
(Strong) DivDiv will Show only strong levels of Divergence.
DivScanner Strategy

DivScanner Strategy helps you Scan the Crypto Market for any type of Divergence and send you notification when it finds one.
DivScanner Strategy Settings

Value, Build From: choose the timeframe that you want to search Divergences on.
FromDate: choose the starting date and time that Divergences can be drown from.
Divergence Strength, Confirmation Method, Divergence Type: explained in the DivDiv indicator settings.
Quote: choose the Quote that you want to search for Divergences on all pairs belong to that Quote.
Included Pairs*: write Pairs you want to add to the search to the Quote list. ex: you chose Quote=BTC and you want to add ETH/USDT to all BTC Pairs so you write USDT in the Included Pairs.
Excluded Pairs*: write Pairs you want to Exclude from the Quote list.
Exclusive Pairs*: If you want DivScanner to run on specific numbers of pairs, then you added them in Exclusive Pairs. ex: Exclusive Pairs=BTC/USDT, LINK/BTC, ETH/USDT
*Text is not case sensitive and doesn’t consider spaces between symbols, just add a comma between each symbol.
Min Volume: write the minimum 24h volume to filter the Quote search. ex: Quote= BTC, MinVolume= 100.
Max Volume: write the maximum 24h volume to filter the Quote search. ex: Quote= BTC, MaxVolume= 1000.
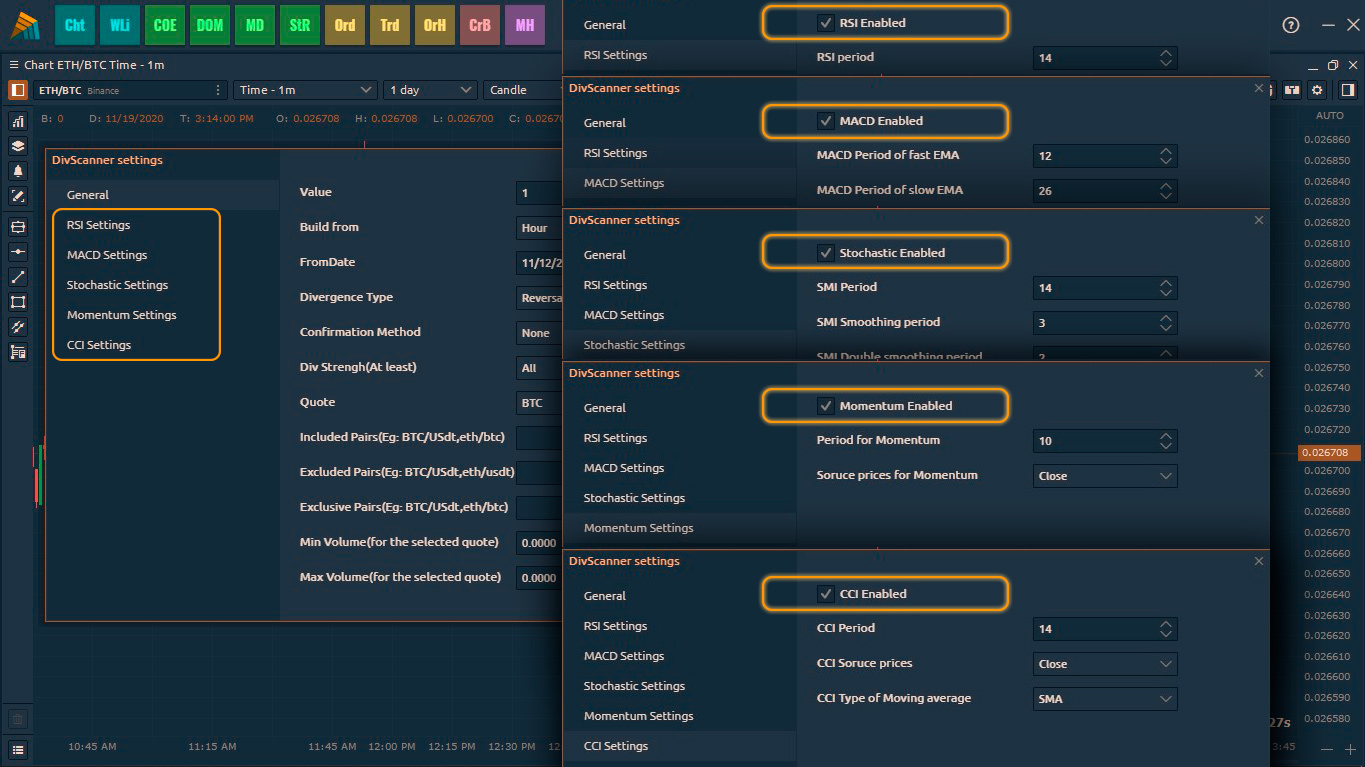
You can also choose which indicators you want to scan for Divergences with DivScanner.

